00018651072021FYFALSEP3YP3Y00018651072021-01-012021-12-3100018651072022-02-25xbrli:shares00018651072021-12-31iso4217:USD00018651072020-12-31iso4217:USDxbrli:shares00018651072020-01-012020-12-3100018651072019-01-012019-12-310001865107us-gaap:CommonStockMember2018-12-310001865107aka:PartnershipUnitsMember2018-12-310001865107us-gaap:AdditionalPaidInCapitalMember2018-12-310001865107us-gaap:AccumulatedOtherComprehensiveIncomeMember2018-12-310001865107us-gaap:RetainedEarningsMember2018-12-310001865107us-gaap:NoncontrollingInterestMember2018-12-3100018651072018-12-310001865107us-gaap:CommonStockMember2019-01-012019-12-310001865107aka:PartnershipUnitsMember2019-01-012019-12-310001865107us-gaap:AdditionalPaidInCapitalMember2019-01-012019-12-310001865107us-gaap:AccumulatedOtherComprehensiveIncomeMember2019-01-012019-12-310001865107us-gaap:NoncontrollingInterestMember2019-01-012019-12-310001865107us-gaap:RetainedEarningsMember2019-01-012019-12-310001865107us-gaap:CommonStockMember2019-12-310001865107aka:PartnershipUnitsMember2019-12-310001865107us-gaap:AdditionalPaidInCapitalMember2019-12-310001865107us-gaap:AccumulatedOtherComprehensiveIncomeMember2019-12-310001865107us-gaap:RetainedEarningsMember2019-12-310001865107us-gaap:NoncontrollingInterestMember2019-12-3100018651072019-12-310001865107aka:PartnershipUnitsMember2020-01-012020-12-310001865107us-gaap:AdditionalPaidInCapitalMember2020-01-012020-12-310001865107us-gaap:AccumulatedOtherComprehensiveIncomeMember2020-01-012020-12-310001865107us-gaap:NoncontrollingInterestMember2020-01-012020-12-310001865107us-gaap:RetainedEarningsMember2020-01-012020-12-310001865107us-gaap:CommonStockMember2020-12-310001865107aka:PartnershipUnitsMember2020-12-310001865107us-gaap:AdditionalPaidInCapitalMember2020-12-310001865107us-gaap:AccumulatedOtherComprehensiveIncomeMember2020-12-310001865107us-gaap:RetainedEarningsMember2020-12-310001865107us-gaap:NoncontrollingInterestMember2020-12-310001865107aka:PartnershipUnitsMember2021-01-012021-12-310001865107us-gaap:AdditionalPaidInCapitalMember2021-01-012021-12-310001865107us-gaap:NoncontrollingInterestMember2021-01-012021-12-310001865107aka:CultureKingsMemberus-gaap:CommonStockMember2021-01-012021-12-310001865107aka:CultureKingsMemberus-gaap:AdditionalPaidInCapitalMember2021-01-012021-12-310001865107aka:CultureKingsMember2021-01-012021-12-310001865107us-gaap:CommonStockMember2021-01-012021-12-310001865107us-gaap:IPOMemberus-gaap:CommonStockMember2021-01-012021-12-310001865107us-gaap:IPOMemberus-gaap:AdditionalPaidInCapitalMember2021-01-012021-12-310001865107us-gaap:IPOMember2021-01-012021-12-310001865107us-gaap:CommonStockMemberaka:ThirdEstateLLCMnmlMember2021-01-012021-12-310001865107us-gaap:AdditionalPaidInCapitalMemberaka:ThirdEstateLLCMnmlMember2021-01-012021-12-310001865107aka:ThirdEstateLLCMnmlMember2021-01-012021-12-310001865107us-gaap:AccumulatedOtherComprehensiveIncomeMember2021-01-012021-12-310001865107us-gaap:RetainedEarningsMember2021-01-012021-12-310001865107us-gaap:CommonStockMember2021-12-310001865107aka:PartnershipUnitsMember2021-12-310001865107us-gaap:AdditionalPaidInCapitalMember2021-12-310001865107us-gaap:AccumulatedOtherComprehensiveIncomeMember2021-12-310001865107us-gaap:RetainedEarningsMember2021-12-310001865107us-gaap:NoncontrollingInterestMember2021-12-310001865107us-gaap:IPOMember2021-09-012021-09-300001865107us-gaap:IPOMember2021-09-300001865107aka:CultureKingsMember2021-03-31xbrli:pure0001865107aka:CultureKingsMemberaka:CultureKingsBusinessMember2021-03-012021-03-310001865107aka:CultureKingsMember2021-03-012021-03-310001865107aka:PPHoldingsLPMember2021-08-180001865107aka:PPHoldingsLPMember2021-09-300001865107aka:PPHoldingsLPMember2021-08-190001865107aka:PPHoldingsLPMember2021-08-192021-08-19iso4217:AUD0001865107aka:PPHoldingsLPMember2021-09-300001865107aka:PPHoldingsLPMember2021-09-012021-09-300001865107srt:AffiliatedEntityMemberaka:SeniorSecuredTermLoanFacilityMembersrt:SubsidiariesMemberus-gaap:SecuredDebtMember2021-03-310001865107srt:AffiliatedEntityMemberus-gaap:LineOfCreditMemberus-gaap:RevolvingCreditFacilityMembersrt:SubsidiariesMember2021-03-310001865107srt:AffiliatedEntityMemberus-gaap:SeniorSubordinatedNotesMembersrt:SubsidiariesMember2021-03-310001865107srt:AffiliatedEntityMemberaka:SeniorSecuredTermLoanFacilityMembersrt:SubsidiariesMemberus-gaap:SecuredDebtMember2021-09-300001865107srt:AffiliatedEntityMemberus-gaap:LineOfCreditMemberus-gaap:RevolvingCreditFacilityMembersrt:SubsidiariesMember2021-09-300001865107aka:DirectorsAndMembersMember2021-09-012021-09-300001865107srt:MinimumMember2021-01-012021-12-310001865107srt:MaximumMember2021-01-012021-12-310001865107us-gaap:FurnitureAndFixturesMember2021-01-012021-12-310001865107us-gaap:MachineryAndEquipmentMember2021-01-012021-12-310001865107us-gaap:ComputerEquipmentMember2021-01-012021-12-310001865107us-gaap:SoftwareDevelopmentMember2021-01-012021-12-310001865107aka:BreakageOfOnlineCreditAndGiftCardsMember2021-01-012021-12-310001865107aka:BreakageOfOnlineCreditAndGiftCardsMember2020-01-012020-12-310001865107aka:BreakageOfOnlineCreditAndGiftCardsMember2019-01-012019-12-310001865107country:US2021-01-012021-12-310001865107country:US2020-01-012020-12-310001865107country:US2019-01-012019-12-310001865107country:AU2021-01-012021-12-310001865107country:AU2020-01-012020-12-310001865107country:AU2019-01-012019-12-310001865107aka:RestOfTheWorldMember2021-01-012021-12-310001865107aka:RestOfTheWorldMember2020-01-012020-12-310001865107aka:RestOfTheWorldMember2019-01-012019-12-310001865107us-gaap:ShippingAndHandlingMember2021-01-012021-12-310001865107us-gaap:ShippingAndHandlingMember2020-01-012020-12-310001865107us-gaap:ShippingAndHandlingMember2019-01-012019-12-31aka:segment0001865107aka:PetalPupLimitedMember2019-08-090001865107aka:PetalPupLimitedMember2019-08-092019-08-090001865107aka:PetalPupLimitedMemberaka:BrandsMember2019-08-090001865107aka:BrandsMember2019-08-092019-08-090001865107aka:PetalPupLimitedMemberus-gaap:CustomerRelationshipsMember2019-08-090001865107us-gaap:CustomerRelationshipsMember2019-08-092019-08-090001865107aka:PetalPupLimitedMember2019-08-092019-12-310001865107aka:PetalPupLimitedMember2019-01-012019-12-310001865107aka:RebdollsIncMember2019-12-060001865107aka:RebdollsIncMember2019-12-062019-12-060001865107aka:RebdollsIncMember2019-12-062019-12-310001865107aka:CultureKingsMember2021-03-310001865107aka:CultureKingsMember2021-03-312021-03-310001865107aka:CultureKingsMemberaka:BrandsMember2021-03-310001865107aka:CultureKingsMemberaka:BrandsMember2021-03-012021-03-310001865107aka:CultureKingsMemberaka:BrandsMember2021-03-312021-03-310001865107us-gaap:CustomerRelationshipsMemberaka:CultureKingsMember2021-03-310001865107us-gaap:CustomerRelationshipsMemberaka:CultureKingsMember2021-03-012021-03-310001865107us-gaap:CustomerRelationshipsMemberaka:CultureKingsMember2021-03-312021-03-310001865107aka:CultureKingsMember2020-01-012020-12-310001865107aka:ThirdEstateLLCMnmlMember2021-10-142021-10-140001865107aka:ThirdEstateLLCMnmlMember2021-10-140001865107aka:BrandsMemberaka:ThirdEstateLLCMnmlMember2021-10-140001865107aka:BrandsMemberaka:ThirdEstateLLCMnmlMember2021-10-142021-10-140001865107us-gaap:CustomerRelationshipsMemberaka:ThirdEstateLLCMnmlMember2021-10-140001865107us-gaap:CustomerRelationshipsMemberaka:ThirdEstateLLCMnmlMember2021-10-142021-10-140001865107aka:PPHoldingsLPMember2021-12-310001865107aka:PPHoldingsLPMemberus-gaap:NoncontrollingInterestMember2021-09-012021-09-300001865107aka:PPHoldingsLPMemberus-gaap:AdditionalPaidInCapitalMember2021-09-012021-09-300001865107us-gaap:FurnitureAndFixturesMember2021-12-310001865107us-gaap:FurnitureAndFixturesMember2020-12-310001865107us-gaap:MachineryAndEquipmentMember2021-12-310001865107us-gaap:MachineryAndEquipmentMember2020-12-310001865107aka:ComputerEquipmentAndCapitalizedSoftwareMember2021-12-310001865107aka:ComputerEquipmentAndCapitalizedSoftwareMember2020-12-310001865107us-gaap:LeaseholdImprovementsMember2021-12-310001865107us-gaap:LeaseholdImprovementsMember2020-12-310001865107us-gaap:CustomerRelationshipsMember2021-01-012021-12-310001865107us-gaap:CustomerRelationshipsMember2021-12-310001865107us-gaap:CustomerRelationshipsMember2020-01-012020-12-310001865107us-gaap:CustomerRelationshipsMember2020-12-310001865107aka:BrandsMember2021-01-012021-12-310001865107aka:BrandsMember2021-12-310001865107aka:BrandsMember2020-01-012020-12-310001865107aka:BrandsMember2020-12-310001865107aka:WebsiteDesignAndSoftwareSystemMember2021-01-012021-12-310001865107aka:WebsiteDesignAndSoftwareSystemMember2021-12-310001865107aka:WebsiteDesignAndSoftwareSystemMember2020-01-012020-12-310001865107aka:WebsiteDesignAndSoftwareSystemMember2020-12-310001865107us-gaap:TrademarksMember2021-01-012021-12-310001865107us-gaap:TrademarksMember2021-12-310001865107us-gaap:TrademarksMember2020-01-012020-12-310001865107us-gaap:TrademarksMember2020-12-310001865107us-gaap:LineOfCreditMembersrt:SubsidiariesMemberaka:PrincessPollyMember2021-12-310001865107us-gaap:LineOfCreditMembersrt:SubsidiariesMemberaka:PrincessPollyMember2020-12-310001865107us-gaap:LetterOfCreditMembersrt:SubsidiariesMemberaka:PrincessPollyMember2020-12-310001865107aka:RebdollsIncMemberus-gaap:RevolvingCreditFacilityMembersrt:SubsidiariesMemberaka:BankOfAmericaNAMember2021-12-310001865107aka:RebdollsIncMemberus-gaap:RevolvingCreditFacilityMembersrt:SubsidiariesMemberaka:BankOfAmericaNAMember2020-12-310001865107aka:PollyHoldcoPtyLrdPollyMembersrt:AffiliatedEntityMemberus-gaap:SecuredDebtMember2021-03-310001865107aka:PollyHoldcoPtyLrdPollyMembersrt:AffiliatedEntityMemberus-gaap:LineOfCreditMemberus-gaap:RevolvingCreditFacilityMember2021-03-310001865107aka:PollyHoldcoPtyLrdPollyMembersrt:AffiliatedEntityMemberus-gaap:SeniorSubordinatedNotesMember2021-03-312021-03-310001865107aka:PollyHoldcoPtyLrdPollyMembersrt:AffiliatedEntityMember2021-03-310001865107aka:PollyHoldcoPtyLrdPollyMembersrt:AffiliatedEntityMemberus-gaap:LondonInterbankOfferedRateLIBORMemberus-gaap:SecuredDebtMember2021-03-312021-03-310001865107aka:PollyHoldcoPtyLrdPollyMembersrt:AffiliatedEntityMemberus-gaap:BaseRateMemberus-gaap:SecuredDebtMember2021-03-312021-03-310001865107aka:PollyHoldcoPtyLrdPollyMembersrt:AffiliatedEntityMemberus-gaap:LineOfCreditMemberus-gaap:LondonInterbankOfferedRateLIBORMemberus-gaap:RevolvingCreditFacilityMember2021-03-312021-03-310001865107aka:PollyHoldcoPtyLrdPollyMembersrt:AffiliatedEntityMemberus-gaap:LineOfCreditMemberus-gaap:BaseRateMemberus-gaap:RevolvingCreditFacilityMember2021-03-312021-03-310001865107aka:PollyHoldcoPtyLrdPollyMembersrt:AffiliatedEntityMemberus-gaap:SeniorSubordinatedNotesMember2021-03-310001865107aka:PollyHoldcoPtyLrdPollyMembersrt:AffiliatedEntityMemberus-gaap:LineOfCreditMemberus-gaap:RevolvingCreditFacilityMember2021-03-312021-03-310001865107aka:PollyHoldcoPtyLrdPollyMembersrt:AffiliatedEntityMemberaka:TermLoanAndSeniorSubordinatedNotesMemberus-gaap:SecuredDebtMember2021-03-310001865107srt:AffiliatedEntityMemberaka:NewSeniorSecuredCreditFacilityMemberus-gaap:SecuredDebtMember2021-09-240001865107srt:AffiliatedEntityMemberaka:NewSeniorSecuredCreditFacilityMemberus-gaap:LineOfCreditMemberus-gaap:RevolvingCreditFacilityMember2021-09-240001865107srt:AffiliatedEntityMemberaka:NewSeniorSecuredCreditFacilityMemberus-gaap:SecuredDebtMember2021-09-242021-09-240001865107srt:AffiliatedEntityMemberaka:NewSeniorSecuredCreditFacilityMemberus-gaap:LineOfCreditMemberus-gaap:RevolvingCreditFacilityMember2021-09-242021-09-240001865107srt:AffiliatedEntityMemberaka:NewSeniorSecuredCreditFacilityMemberus-gaap:LineOfCreditMemberus-gaap:LondonInterbankOfferedRateLIBORMemberus-gaap:RevolvingCreditFacilityMember2021-09-242021-09-240001865107srt:AffiliatedEntityMemberaka:NewSeniorSecuredCreditFacilityMemberus-gaap:LineOfCreditMemberus-gaap:RevolvingCreditFacilityMembersrt:MinimumMember2021-09-242021-09-240001865107srt:AffiliatedEntityMemberaka:NewSeniorSecuredCreditFacilityMemberus-gaap:LineOfCreditMembersrt:MaximumMemberus-gaap:RevolvingCreditFacilityMember2021-09-242021-09-240001865107srt:AffiliatedEntityMemberaka:NewSeniorSecuredCreditFacilityMember2021-09-240001865107srt:AffiliatedEntityMemberaka:NewSeniorSecuredCreditFacilityMemberaka:LeverageRatioExceeds275Member2021-09-242021-09-240001865107srt:AffiliatedEntityMemberaka:NewSeniorSecuredCreditFacilityMemberaka:LeverageRatioGreaterThanOrEqual225Member2021-09-242021-09-240001865107srt:AffiliatedEntityMemberaka:NewSeniorSecuredCreditFacilityMemberaka:LeverageRatioGreaterThanOrEqual225Member2021-09-240001865107aka:NewSeniorSecuredCreditFacilityMember2021-09-012021-09-300001865107aka:NewSeniorSecuredCreditFacilityMemberus-gaap:LineOfCreditMemberus-gaap:RevolvingCreditFacilityMember2021-10-012021-10-310001865107aka:NewSeniorSecuredCreditFacilityMemberus-gaap:LineOfCreditMemberus-gaap:RevolvingCreditFacilityMember2021-10-310001865107aka:NewSeniorSecuredCreditFacilityMemberus-gaap:LineOfCreditMemberus-gaap:RevolvingCreditFacilityMember2021-11-012021-11-300001865107us-gaap:NotesPayableToBanksMember2021-12-310001865107us-gaap:NotesPayableToBanksMember2020-12-310001865107us-gaap:SecuredDebtMember2021-12-310001865107us-gaap:SecuredDebtMember2020-12-310001865107us-gaap:RevolvingCreditFacilityMember2021-12-310001865107us-gaap:RevolvingCreditFacilityMember2020-12-310001865107srt:MinimumMember2021-12-310001865107srt:MaximumMember2021-12-310001865107us-gaap:DomesticCountryMember2021-12-310001865107us-gaap:StateAndLocalJurisdictionMember2021-12-310001865107aka:A2021OmnibusIncentivePlanMemberus-gaap:EmployeeStockOptionMember2021-12-310001865107aka:A2021OmnibusIncentivePlanMemberus-gaap:EmployeeStockOptionMember2021-09-012021-09-300001865107us-gaap:EmployeeStockMemberaka:A2021EmployeeStockPurchasePlanMember2021-12-310001865107us-gaap:EmployeeStockMemberaka:A2021EmployeeStockPurchasePlanMember2021-09-012021-09-300001865107aka:A2018StockAndIncentiveCompensationPlanMemberaka:IncentiveUnitsMember2018-12-310001865107us-gaap:EmployeeStockOptionMember2021-01-012021-12-310001865107aka:A2021OmnibusIncentivePlanMemberus-gaap:EmployeeStockOptionMember2021-01-012021-12-310001865107us-gaap:RestrictedStockUnitsRSUMember2021-01-012021-12-310001865107us-gaap:RestrictedStockUnitsRSUMember2020-12-310001865107us-gaap:RestrictedStockUnitsRSUMember2021-12-310001865107aka:TimeBasedIncentivePartnershipUnitsMember2021-01-012021-12-310001865107aka:TimeBasedIncentivePartnershipUnitsMember2019-12-310001865107aka:TimeBasedIncentivePartnershipUnitsMember2020-01-012020-12-310001865107aka:TimeBasedIncentivePartnershipUnitsMember2020-12-310001865107aka:TimeBasedIncentivePartnershipUnitsMember2021-12-310001865107aka:TimeBasedIncentivePartnershipUnitsMember2019-01-012019-12-310001865107us-gaap:PerformanceSharesMember2021-12-310001865107us-gaap:PerformanceSharesMember2019-12-310001865107us-gaap:PerformanceSharesMember2020-01-012020-12-310001865107us-gaap:PerformanceSharesMember2020-12-310001865107us-gaap:PerformanceSharesMember2021-01-012021-12-310001865107aka:TransitionAgreementMemberaka:FormerExecutiveMember2020-12-310001865107us-gaap:EmployeeStockOptionMember2020-01-012020-12-310001865107us-gaap:EmployeeStockOptionMember2019-01-012019-12-310001865107us-gaap:RestrictedStockUnitsRSUMember2020-01-012020-12-310001865107us-gaap:RestrictedStockUnitsRSUMember2019-01-012019-12-310001865107us-gaap:PerformanceSharesMember2019-01-012019-12-31aka:vote0001865107us-gaap:SeniorSubordinatedNotesMembersrt:SubsidiariesMemberaka:PrincessPollyMember2021-03-310001865107aka:NewSeniorSecuredCreditFacilityMemberus-gaap:LineOfCreditMemberus-gaap:SubsequentEventMemberus-gaap:RevolvingCreditFacilityMember2022-01-262022-01-260001865107aka:NewSeniorSecuredCreditFacilityMemberus-gaap:LineOfCreditMemberus-gaap:SubsequentEventMemberus-gaap:RevolvingCreditFacilityMember2022-01-260001865107us-gaap:SubsequentEventMember2022-01-31aka:squareFeet0001865107us-gaap:SubsequentEventMember2022-03-31
UNITED STATES
SECURITIES AND EXCHANGE COMMISSION
Washington, D.C. 20549
__________________________________________________________________________________________________
FORM 10-K
__________________________________________________________________________________________________
(Mark One)
☒ ANNUAL REPORT PURSUANT TO SECTION 13 OR 15(d) OF THE SECURITIES EXCHANGE ACT OF 1934
For the fiscal year ended December 31, 2021
OR
☐ TRANSITION REPORT PURSUANT TO SECTION 13 OR 15(d) OF THE SECURITIES EXCHANGE ACT OF 1934
For the transition period from __________ to __________
Commission File Number: 001-40828
__________________________________________________________________________________________________
a.k.a. Brands Holding Corp.
(Exact name of registrant as specified in its charter)
__________________________________________________________________________________________________
| | | | | | | | |
| Delaware | | 87-0970919 |
(State or other jurisdiction of incorporation or organization) | | (I.R.S. Employer
Identification No.) |
100 Montgomery Street, Suite 1600
San Francisco, California 94104
(Address of principal executive offices, including zip code)
415-295-6085
(Registrant’s Telephone Number, Including Area Code)
__________________________________________________________________________________________________
Securities registered pursuant to Section 12(b) of the Act:
| | | | | | | | | | | | | | |
| Title of each class | | Trading Symbol(s) | | Name of each exchange on which registered |
Common Stock, par value $0.001 per share | | AKA | | New York Stock Exchange |
Indicate by check mark if the registrant is a well-known seasoned issuer, as defined in Rule 405 of the Securities Act of 1933 (“Securities Act”). Yes ☐ No ☒
Indicate by check mark if the registrant is not required to file reports pursuant to Section 13 or Section 15(d) of the Securities Exchange Act of 1934 (the “Exchange Act”). Yes ☐ No ☒
Indicate by check mark whether the registrant (1) has filed all reports required to be filed by Section 13 or 15(d) of the Exchange Act during the preceding 12 months (or for such shorter period that the registrant was required to file such reports), and (2) has been subject to such filing requirements for the past 90 days. Yes ☒ No ☐
Indicate by check mark whether the registrant has submitted electronically every Interactive Data File required to be submitted pursuant to Rule 405 of Regulation S-T (§232.405 of this chapter) during the preceding 12 months (or for such shorter period that the registrant was required to submit such files). Yes ☒ No ☐
Indicate by check mark whether the registrant is a large accelerated filer, an accelerated filer, a non-accelerated filer, a smaller reporting company, or an emerging growth company. See the definitions of “large accelerated filer,” “accelerated filer,” “smaller reporting company,” and “emerging growth company” in Rule 12b-2 of the Exchange Act.
| | | | | | | | | | | | | | |
| Large accelerated filer | ¨ | | Accelerated Filer | ¨ |
| | | | |
| Non-accelerated filer | x | | Smaller Reporting Company | ¨ |
| | | | |
| | | Emerging Growth Company | x |
If an emerging growth company, indicate by check mark if the registrant has elected not to use the extended transition period for complying with any new or revised financial accounting standards provided pursuant to Section 13(a) of the Exchange Act. x
Indicate by check mark whether the registrant has filed a report on and attestation to its management’s assessment of the effectiveness of its internal control over financial reporting under Section 404(b) of the Sarbanes-Oxley Act (15 U.S.C. 7262(b)) by the registered public accounting firm that prepared or issued its audit report. ☐
Indicate by check mark whether the registrant is a shell company (as defined in Rule 12b-2 of the Exchange Act). Yes ☐ No x
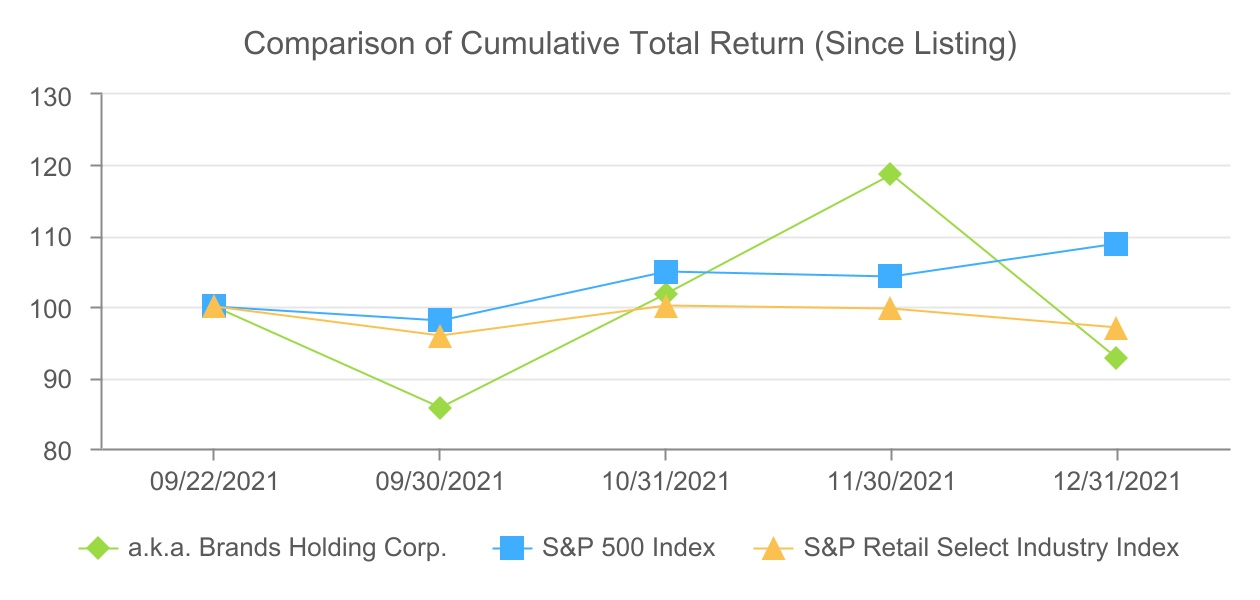
The registrant was not a public company as of June 30, 2021, the last business day of its most recently completed second fiscal quarter, and therefore, cannot calculate the aggregate market value of its voting and non-voting common equity held by non-affiliates as of such date. The registrant’s common stock began trading on the New York Stock Exchange on September 22, 2021.
As of February 25, 2022, the registrant had 128,647,836 shares of common stock outstanding.
DOCUMENTS INCORPORATED BY REFERENCE
Portions of the registrant's definitive proxy statement for its 2022 Annual Meeting of Stockholders (“Proxy Statement”), to be filed within 120 days of the registrant's fiscal year ended December 31, 2021, are incorporated by reference into Part III of this Annual Report on Form 10-K where indicated. Except with respect to information specifically incorporated by reference in this Form 10-K, the Proxy Statement is not deemed to be filed as part of this Form 10-K.
a.k.a. BRANDS HOLDING CORP.
FORM 10-K
TABLE OF CONTENTS
FORWARD-LOOKING STATEMENTS
All statements other than statements of historical facts contained in this Annual Report on Form 10-K, including statements regarding our future results of operations and financial position, or that describe our plans, goals, intentions, objectives, strategies, expectations, beliefs and assumptions, are forward-looking statements. The words “believe,” “may,” “might,” “will,” “estimate,” “continue,” “anticipate,” “intend,” “expect,” “project,” “plan,” “objective,” “could,” “would,” “should” and similar expressions are intended to identify forward-looking statements. We have based these forward-looking statements largely on our current expectations and projections about future events and financial trends that we believe may affect our financial condition, results of operations, business strategy, short-term and long-term business operations and objectives, and financial needs. We caution that the forward-looking statements in this Annual Report on Form 10-K are subject to a number of known and unknown risks, uncertainties and assumptions that may cause our actual results, performance or achievements to be materially different from any future results, performances or achievements expressed or implied by the forward-looking statements. Factors that could contribute to these differences include, among other things:
•the effects of the COVID-19 pandemic on our operations, customer demand and our suppliers’ ability to meet our needs;
•rapidly-changing consumer preferences in the apparel, footwear and accessories industries;
•failure to acquire new customers, retain existing customers, or maintain average order value levels;
•the effectiveness of our marketing and our level of customer traffic;
•merchandise return rates;
•our success in identifying brands to acquire, integrate and manage on our platform, and expansion into new markets;
•the global nature of our business;
•our use of social media platforms and influencer sponsorship initiatives;
•inherent challenges in measurement to which certain of our key operating metrics are subject;
•tax liabilities that may increase the costs our consumers would have to pay for our offerings;
•economic downturns and market conditions beyond our control;
•fluctuations between non-U.S. currencies and the U.S. dollar;
•our ability to attract and retain highly qualified personnel;
•fluctuations in wage rates and the price, availability and quality of raw materials and finished goods;
•interruptions in or increased costs of shipping and distribution; and
•the other factors set forth under “Risk Factors.”
Moreover, we operate in a very competitive and rapidly changing environment, and new risks emerge from time to time. It is not possible for our management to predict all risks, nor can we assess the impact of all factors on our business or the extent to which any factor, or combination of factors, may cause actual results to differ materially from those contained in any forward-looking statements we may make. In light of these risks, uncertainties and assumptions, the forward-looking events and circumstances discussed in this Annual Report on Form 10-K may not occur, and actual results could differ materially and adversely from those anticipated or implied in the forward-looking statements.
You should not rely upon forward-looking statements as predictions of future events. Although we believe that the expectations reflected in the forward-looking statements are reasonable, we cannot guarantee that the future results, levels of activity, performance or events and circumstances reflected in the forward-looking statements will be achieved or occur. Moreover, neither we nor any other person assumes responsibility for the accuracy and completeness of the forward-looking statements. We undertake no obligation to update publicly any forward-looking statements for any reason after the date of this Annual Report on Form 10-K to conform these statements to actual results or changes in our expectations, unless otherwise required by law.
PART I
ITEM 1. BUSINESS
Our Vision
To be the global leader in direct-to-consumer fashion for the next generation of consumers through a dynamic platform of digitally native brands.
Who We Are
a.k.a. is a brand accelerator of direct-to-consumer (DTC) fashion brands for the next-generation. Beginning with the acquisition of Princess Polly in 2018, we created a portfolio of complementary brands with our subsequent acquisitions of Petal & Pup and Rebdolls in 2019 and Culture Kings and mnml in 2021. We target high-potential brands that we believe are at a pivotal point in their growth trajectory that we can integrate into our platform and accelerate their growth. Leveraging our proven track-record, industry expertise and operational synergies, we believe our brands can grow faster, reach broader audiences, achieve greater scale and enhance their profitability. We believe we are disrupting the status quo and pioneering a new approach to fashion.
Through our portfolio of high-growth, digitally-focused global brands, we reach a broad audience across accessible price points and varied styles. Our current brands all share a common focus on Millennial and Gen Z consumers who seek fashion inspiration on social media and primarily shop online. Nimble by design, our innovative brands are launched and fueled on social media channels. They are customer-centric and have authentic and engaging relationships with their target audiences through highly relevant social content and other digital marketing strategies. Leveraging innovative, data-driven insights, our brands introduce fresh content and high-quality merchandise daily. Our platform accelerates the growth and profitability of our existing brands, and we aim to continue expanding our portfolio. Simply put, our brands are better together.
While we have owned Princess Polly, Petal & Pup and Rebdolls from before 2020, information presented hereafter on an “across a.k.a. Brands” basis assumes we also owned Culture Kings for all periods presented.
We Efficiently Acquire Customers Through Inspiring, Digital Content
Our brands engage with customers by releasing a stream of inspiring digital content at high frequency. We believe our content-rich narrative and authentic brand messaging drives organic traffic to our websites, efficiently generating demand, enhancing connectivity with customers and amplifying our brand communities. Our brands maintain relationships with approximately 17,000 influencers globally and utilize them to test and launch new products, gather customer feedback, increase brand awareness and acquire new customers in a cost-effective manner. In 2021, across a.k.a. Brands, we inspired more than 8.7 million followers on social media and served more than 3.7 million active customers.
We Leverage Data-Driven Insights to Curate High-Quality, Affordable Fashion
Our brands aim to deliver constant newness and excitement by creating and curating on-trend and affordable fashion styles that customers love. We utilize real-time data and consumer insights to identify the latest trends and work with our global sourcing network and brand partners to quickly bring new, high-quality products to market. Our agile “test-and-repeat” merchandising model enables the flexibility to quickly react to customer demand and test product appeal without taking large initial inventory positions, yet still capture in-season demand. This model ensures that our merchandise is always on-trend and customer-led because we only replenish the styles that our customers show us that they like.
Our Brands Offer a High Mix of Exclusive Styles to Drive Loyalty
Our brands’ compelling merchandising strategy is anchored by a high proportion of exclusive styles that cannot be found elsewhere. More than 47% of our revenue is derived from products exclusive to a.k.a. Brands, which increases both demand and customer loyalty. Our customers’ satisfaction with the fit, quality, affordability and exclusivity of our styles is further reflected in our sales return rates across our brands, which was well below industry average in 2021 at approximately 14%.
Our Platform Creates Value by Driving Synergies Across the Portfolio
Deep Industry Expertise
Our brands have access to our highly-skilled leadership team, each of whom has a proven track-record and decades of experience building and scaling successful eCommerce businesses. We have deep expertise in the business of fashion, and we support our brands so they can focus on customer-facing priorities such as branding, merchandising and maintaining an authentic connection with customers.
Innovation Hub and Knowledge Sharing
Our platform enables and encourages a network of cross-brand learnings to advance innovation and promote best practices – what accelerates profitable growth for one brand can accelerate profitable growth for others. Across our brands, we test and learn digital innovation and facilitate knowledge sharing and benchmarking of key performance metrics to improve growth, operational efficiency and profitability.
Flexible Technology Stack and Operations
Our platform leverages a broad network of third-party service and technology providers, which allows us to implement the latest capabilities with limited upfront investment and quickly adopt innovations in the market. We utilize a combination of owned and third-party logistics and fulfillment assets and third-party technology partners, creating flexibility to support our high-growth brands. We customize our approach for each brand to allow for optimization and tailored growth tools, which sets us apart from other centralized platforms. For example, while we maintain a network of proven vendors across the portfolio, we allow our brands to take a custom approach to which vendors they use. Therefore, there is minimal operational disruption when we acquire new brands given our flexible operations approach. Additionally, through our a.k.a. platform and the scale it provides, we negotiate favorable rates with our vendors, providing our brands with attractive terms and enhancing overall profitability.
We Promote Diversity and Practice Responsible Fashion
Our brands reflect the diversity and beauty of our customers and we continuously seek ways to expand the diversity in our brands, products and marketing. We believe diversity and sustainability align with our core values and drive better results. We operate responsibly and are committed to responsible fashion and sustainability through prioritization of transparency, fair labor practices and reduced waste.
Our Powerful Economic Model
We believe our platform is differentiated by its unique ability to attract and retain a wide range of Millennial and Gen Z consumers through authentic brand messaging and curated, on-trend fashion. In 2021, across a.k.a. Brands, we:
•attracted approximately 289 million site visits, with 61% from unpaid sources
•grew our active customer base by 61% from 2020, who placed 48% more orders at 7% higher average order value compared to 2020
•had a low sales return ratio of approximately 14%
We believe our robust growth and profitability validate our platform approach and asset-light business model. We grew revenue by 160% from 2020 to 2021 and achieved $562.2 million in net sales, while our adjusted EBITDA increased by 2.1 times from 2020 to 2021.
Industry Overview
Large and Growing Global Apparel, Footwear and Accessories Industry
We primarily operate in the large and growing global apparel, footwear and accessories industry. According to Euromonitor, a consumer market research company, the industry grew to an annual spend of $1.7 trillion in retail sales in 2021 from $1.3 trillion in 2010, representing a CAGR of 2.7% over this time period. Although 2021 retail sales were negatively impacted by the COVID-19 pandemic, the industry is projected to grow at a 8.1% CAGR from 2020 to 2025. Though we ship our products globally, we operate primarily in two geographies, the U.S. and Australia. The U.S. apparel, footwear and accessories market grew to $370 billion in 2019 and is expected to grow at a 8.9% CAGR from 2020 to 2025. The Australian apparel, footwear and accessories market grew to $18.7 billion in 2019 and is expected to grow at a 6.5% CAGR from 2020 to 2025. We believe the key factors driving growth within the global apparel, footwear and accessories industry include favorable demographic trends and desire for constant newness.
Apparel, Footwear and Accessories Shopping has Been Rapidly Shifting Online
Consumers are increasingly turning to online channels to make purchases, driven by the growing Millennial and Gen Z populations and the increasing influence of social and digital media channels. According to Euromonitor, the global online apparel, footwear and accessories market was valued at approximately $300 billion in 2019, and is expected to reach $543 billion by 2025, representing a 10.3% CAGR, with online outpacing the growth of the overall market.
In the U.S., online spend was $94 billion in 2019 and is expected to reach $192 billion by 2025, representing a 12.7% CAGR. Online penetration of apparel, footwear and accessories in the U.S. has increased from 7.4% to 35.0% from 2010 to 2021, and Euromonitor expects online penetration to reach approximately 43% in the U.S. by 2025. The COVID-19 pandemic accelerated digital adoption across retail with online penetration of apparel, footwear and accessories expanding approximately 1,136 basis points in the U.S. during 2020.
Digital-Savvy Millennial and Gen Z Consumers Seeking the Next-Generation Shopping Experience
According to data from the United Nations, Millennial and Gen Z consumers, our primary target demographic today, account for 32% and 23% of the global population, respectively, making them a large and growing demographic group with significant economic influence. The U.S. Millennial and Gen Z population is also very diverse, collectively accounting for approximately 60% of the U.S. minority population. This growing, diverse base of young consumers is shaping the evolving retail landscape and differs from other generations given a focus on the following:
•Aspire to express their individual style through fashion and desire for constant newness
•Seek an emotional connection with brands through frequent interaction and shared values
•Shop and explore content online more than older generations
•Engage with social media and digital content from influencers as a primary source of inspiration and discovery to inform their purchasing decisions
•Creative Agency Composed found in November 2019 that approximately 60% of U.S. Gen Z shoppers utilize Instagram to discover new brands and products
•According to the Global Web Index, Millennials and Gen Z worldwide spend approximately 4 hours daily on average on social media
•Demand a higher accountability for brands and seek to purchase from companies that align with their values, including a focus on social responsibility, sustainability, diversity and inclusion.
•5WPR’s 2020 Consumer Culture Report found in November 2019 that approximately 83% of Millennials want to buy from companies that align with their belief and values
Changing Landscape of Brands
Over the last decade, the retail landscape has transformed, as mall-based stores, including department stores and specialty retailers, rapidly shrank their footprints or closed all together. According to IBISWorld, department store locations in the U.S. declined by approximately 30% to 6,000 in 2020 from 8,600 in 2011. In addition to department store closures, we believe many specialty retailers also experienced similar declines during the same time period. Offline retailers, as a whole, did not keep up with changing consumer preferences, such as the shift to online shopping, and carry high fixed costs associated with their large store footprints which become increasingly less profitable. These pressures led to store closures in recent years that we believe creates available market share for new, primarily digital competitors.
As consumers moved to online shopping platforms and as social media increasingly captured consumers’ time, a new generation of brands began building direct relationships with their customers through their own branded eCommerce sites, a limited number of owned stores and social media platforms. These direct channels allow brands to engage directly with consumers and build unique brand identities to appeal to specific target demographics. These factors, combined with Millennial and Gen Z consumers seeking brands that are unique and offer an emotional connection, gave rise to a fragmented landscape of digital and direct-to-consumer brands. Additionally, direct to consumer brands are not tied to a traditional wholesale development calendar, so they have greater merchandising flexibility and can get trends to customers faster.
The Attractive Streetwear Industry
With our recent acquisitions of Culture Kings and mnml, we entered the growing, global streetwear market, which was estimated to be $185 billion in 2019. Streetwear, which is primarily comprised of footwear, T-shirts and other apparel and accessory items, has gained an almost cult-like following among consumers. This is particularly true for Gen Z, which is estimated to be the largest group of streetwear shoppers, with approximately 60% of shoppers under the age of 25.
Growing demand for streetwear is driven by product exclusivity and versatility, as well the broader casualization of fashion. The anticipation of limited opportunity to buy drives scarcity value, offering a unique avenue for self-expression among consumers. These unique attributes of streetwear give it a cache or “cool” factor among consumers which is driving outsized industry growth.
Our Competitive Strengths
Diversified Portfolio of Global Brands Targets Distinct Audiences and Expands Reach
We strategically acquired a portfolio of brands with strong followings from Millennial and Gen Z customers. The collective reach of our brands is diversified across age, gender, geography and life stage. Yet, each brand targets a distinct customer segment. The typical customer is a 15-25 year old woman for Princess Polly, a 25-40 year old woman for Petal & Pup, an 18-34 year old plus-sized diverse woman for Rebdolls, an 18-35 year old male for Culture Kings and a 18-35 year old male for mnml. Each of our brands maintains their own identities and tailors brand messaging and products to their unique customer bases, creating authentic connections and driving strong loyalty. Additionally, our global footprint and portfolio of brands allows us to diversify from potential risks associated with a single brand or a single market, enhancing platform level returns.
Demand-led, Data-driven Merchandising Drives Speed to Market and Full Price Sell Through
Our brands utilize a data-driven approach to merchandising, identifying consumer demand trends and introducing relevant products with rapid speed-to-market. Princess Polly pioneered the “test-and-repeat” product buying model, and now our other brands have learned the strategy from being a part of the a.k.a. platform and are employing it as well. The brands make initial purchases of a wide variety of new products in small quantities, releasing a steady stream of new arrivals as frequently as daily and observe early signals on transaction and browsing patterns to quickly validate consumer appeal. This customer feedback loop allows our brands to rapidly replenish successful styles and scale-back on less successful products. Our on-trend offerings and short product cycle are designed to generate constant newness, encourage product discovery, drive online traffic and full price sell through. In 2021, the average order value across our brands increased by 7%.
Additionally, our presence in the U.S. and Australia allows us to monitor seasonal trends across markets months and even seasons in advance. We leverage these data-driven demand insights from one hemisphere to inform purchasing decisions for the following season in the other hemisphere. We can also ship end of season merchandise to the other hemisphere to avoid costly end of season markdowns.
The value proposition of our brands is further enhanced through a high mix of exclusive products that cannot be found elsewhere. In 2021, more than 80% of merchandise sold at Princess Polly was proprietary. In 2021, approximately 38% of products sold at Culture Kings were exclusive via owned brands, licensed brands, limited editions and brand collaborations. We believe the high portion of exclusive offerings generates excitement, anticipation and loyalty among customers, fuels traffic and demand, and differentiates us competitively. The strong margin profile of our proprietary assortment further improves overall profitability. Additionally, our brands standardize the sizing of their proprietary products and provide customers with better sizing guides, inspiring consumer confidence in quality and fit. In 2021, the sales return rate across a.k.a. Brands was 14%, which is significantly lower than industry average.
Inspirational Content Propels Customer Engagement and Efficient Marketing
Our brands drive continuous engagement with customers through inspiring digital content. We believe the quality and quantity of our content differentiates us from our competitors and seamlessly delivers each brand’s core messaging and lifestyle positioning. We release fresh content as often as hourly across a variety of digital mediums. Our brands have built a community of over 8.7 million brand loyalists and enthusiasts across multiple social media channels, including Instagram, Facebook, YouTube and TikTok, and our brands constantly evolve their customer engagement strategy.
Our brands partner with an extensive network of approximately 17,000 influencers, focusing on those with small to medium, but loyal, followings. We believe these micro-influencers have a strong emotional connection with our brands and feature our products in a highly authentic way that resonates with customers. Our focus on micro-influencers is intended to create a more authentic relationship with customers, mitigate the risk from individual celebrity or macro influencer endorsements and achieve higher returns on our marketing investment. Our strong value proposition combined with our efficient marketing tactics results in low customer acquisition costs and high customer lifetime value.
Additionally, Culture Kings operates eight experiential concept stores in major cities in Australia and New Zealand that serve as powerful customer acquisition tools, and provide customers a unique and immersive brand experience. The stores are one-of-a-kind retail experiences, with celebrity events, activations and in-store gamification. Culture Kings captures compelling content from their stores and events and promotes it on their digital channels, driving increased brand awareness. Culture Kings is the only brand in our current portfolio with stores.
Powerful Platform Accelerates Profitable Growth
Our brands operate independently but have access to resources, guidance and vendors at the a.k.a. level. We believe this model balances scale-enabled cost savings with operational flexibility, facilitates low-risk innovation and accommodates the needs of our brands at various stages of growth. Our platform is designed to provide collective advantages and accelerate profitable growth in both existing and new markets and allows us to manage the brands at a portfolio level.
•Asset-light, third party approach drives operational synergies while maintaining flexibility. We maintain a wide network of third-party technology vendors and suppliers across our sourcing, distribution, technology and back-office functions. We utilize common providers across brands where possible and leverage our scale to negotiate collectively to drive cost and operating synergies. As a result, our brands are able to focus on customer engagement, brand building and marketing, while benefiting from operational services at scaled pricing that the brands would be unlikely to obtain on a stand-alone basis. For instance, we have optimized our logistics and fulfillment capacity by utilizing a combination of owned assets and a network of third-party vendors, allowing for the flexibility to make real-time operational adjustments to accommodate the needs of our high-growth brands.
Our flexible and asset light approach to technology allows us to stay at the forefront of innovation in order to better serve our customers and enhance profitability. We aim to stay on the forefront of digital innovation by experimenting with emerging capabilities that enable our brands to enhance the customer experience in a cost-effective manner. Additionally, we are often early adopters of the latest innovations and are viewed as an attractive partner for leading technology platforms. We consider the nimbleness enabled by our third-party technology a compelling advantage over our competitors who maintain proprietary technology platforms that require significant initial investment, ongoing maintenance costs and generally creates long lead times to deploy and leverage.
•Testing of innovative solutions and shared best practices. While our brands have broad autonomy to experiment with new operational solutions, at the platform level we identify best practices and facilitate the sharing of this knowledge across our brands. For instance, the “test-and-repeat” model first deployed by Princess Polly has been subsequently adopted by Petal & Pup. We also standardized operational and financial performance metrics so that our brands can benchmark against each other.
•Highly experienced management team. We assembled a highly experienced executive leadership team with deep and diversified eCommerce and fashion experience that spans from start-ups to Fortune 500 companies. Our a.k.a. Brands executive team complements our brand management teams by providing significant experience in scaling digital businesses over the last 20 years.
•Next generation culture. While each of our brands celebrates its own unique culture and brand values, we collectively embrace a next generation mindset:
•We are customer-led; focusing relentlessly on delivering a high-quality customer experience,
•We move fast; executing on innovative ideas swiftly,
•We are data driven; using data and analytics to make smarter decisions every day,
•We are growth minded; testing and learning continuously in and across our brands,
•We are diverse; celebrating and expanding the diversity of our customers and teams,
•We act with integrity and practice responsible fashion; when in doubt, we resort to the high standard.
Our Growth Strategies
We believe our global direct-to-consumer fashion brands are disrupting categories with strong fundamental growth and capitalizing on long-term global secular tailwinds. We intend to execute the following strategies to expand our platform and gain market share:
Grow our Brands Organically in our Existing Markets
•Grow Brand Awareness and Acquire New Customers. We believe our brands are underpenetrated in the markets in which they operate. We think there is a significant opportunity to grow awareness of our brands due to the continued secular shift to eCommerce, as well as the strength of our highly efficient, data-driven marketing model. We intend to efficiently acquire new customers through continued investment in our content creation and social media capabilities, as well as through our network of approximately 17,000 influencers. Through continued investment in these initiatives, we believe we will be able to further appeal to our core demographic of Millennial and Gen Z consumers and increase our market share.
•Expand Product Categories and Offerings. We believe our brands are well positioned to grow by expanding product styles and entering new categories that are complementary to our brands’ current offerings. Our brands aim to identify trends and evaluate opportunities leveraging digital capabilities, data-driven insights and a test-and-repeat merchandising model. We believe our brands have a significant opportunity to expand product ranges, increase average order value and broaden customer reach. We intend to continue to increase our mix of owned brands and exclusive offerings, which we believe generate significantly higher margins and drive traffic to our websites.
•Continue to Increase Loyalty and Wallet Share. We intend to deepen customer relationships to improve customer retention and increase wallet share. We aim to achieve this by enhancing our user experience, improving engagement, refining our customer segmentation, increasing personalization, launching loyalty programs across our brands and constantly introducing new styles, designer collaborations and exclusive items. Our authentic content and steady stream of new styles encourages deep connections with new and existing customers, driving customer retention rate of 66% in 2021 across a.k.a. Brands, and resulting in an attractive customer lifetime value.
Grow through Acquisitions
Acquiring new brands is core to our strategy and an important driver of our future growth. Since our inception in 2018, we successfully acquired and integrated five brands onto our platform. We employ a corporate development team dedicated to the identification, evaluation and acquisition of brands, and we maintain a strong pipeline of potential targets which typically includes multiple acquisition opportunities at differing stages of evaluation.
We seek brands that diversify our portfolio through new demographics, markets or fashion tastes, which allows us to grow without cannibalizing our current brands. We seek direct-to-consumer brands with strong customer followings and a proven track record of operating profitably but need help scaling to further accelerate their growth. We look for talented and passionate teams who have proven abilities to leverage data, technology and content to grow. We seek asset-light brands that have the potential to benefit from the a.k.a. platform, expertise and resources. We look for brands with similar operating and financial characteristics as our existing brands. We are continuously evaluating opportunities for such acquisitions
We believe our demonstrated ability to provide infrastructure, expertise and capital to scale brands and create significant value make us an attractive partner which provides us a competitive advantage in acquiring new brands.
Grow Internationally
We intend to leverage the strength of our brands and our ability to connect with customers to expand into new international markets beyond our core U.S. and Australian markets. Net sales to customers outside of the U.S. and Australia was $74 million across 220 countries and territories and represented 13% of total sales in 2021.
We will continue to target markets that demonstrate strong social and digital media usage. We identified several markets in which we believe we can introduce one or more of our brands, such as expanding Culture Kings in Korea and Japan and Princess Polly in Canada, Europe and the U.K. We believe our experience growing the Princess Polly and Petal & Pup brands in the U.S. creates a proven roadmap to help us successfully introduce our brands globally.
Continue to Drive Efficiencies Across Our Platform
As we continue to scale organically and through acquisitions, we aim to improve operational performance across our platform and enhance profitability. We will also look for ways to reduce our input costs by leveraging our collective scale to negotiate improved terms with suppliers and vendors, including for raw materials, freight and shipping. As our brands grow and gain scale, we intend to invest in automation and process improvement within our operations to drive lower variable costs and improved profitability.
Our Brands
The a.k.a. Brands platform consists of five differentiated brands, Princess Polly, Culture Kings, Petal & Pup, mnml and Rebdolls.
Princess Polly: Founded in Australia in 2010, Princess Polly joined the a.k.a. Brands platform in July 2018. With a tagline of “Wear It This Weekend,” Princess Polly focuses on providing fun dresses, tops, shoes and accessories with slim fit, body-confident and trendy fashion designs. The brand operates exclusively online and targets a female customer between the ages of 15 and 25, who value the brand’s high quality assortment, compelling price points and free and fast shipping. Princess Polly customers are inspired by the constant stream of inspirational social media content and the fresh, new and affordable merchandise arriving daily. Since joining the a.k.a. Brands platform, Princess Polly has experienced rapid growth and increasing brand awareness in the United States.
Culture Kings: Founded in Australia in 2008, Culture Kings joined the a.k.a. Brands platform in March 2021. Culture Kings is a premium multi-channel retailer of streetwear apparel, footwear, headwear and accessories. The brand offers its customers a curated assortment from over one hundred leading third-party streetwear brands, as well as a large and growing portfolio of owned brands and exclusive products that embody the relationship between music, sport, art and fashion. The brand targets male consumers between the ages of 18 and 35 who are fashion conscious, highly social and digitally focused. More than 50% of Culture Kings’ products are exclusive and approximately 80% of its sales are made online. Culture Kings engages with customers through a combination of compelling, online and offline marketing strategies that leverage the latest in music, fashion, art and celebrities to create brand hype and product excitement.
The brand operates eight experiential concept stores in major cities in Australia and New Zealand that serve as a powerful customer acquisition tool, and provide customers a unique and immersive brand experience. The stores feature engaging in-store designs and product displays, store fronts designed by best-in-class graffiti artists, exclusive product releases including promotional products only available in-store, and event-driven in-store activations. The stores host a variety of public events and creative activities designed to instill feelings and emotions of excitement such as sneaker vending machine, basketball shooting competitions, live DJ sessions and appearances of global celebrities and tastemakers, including athletes and on-trend music artists. The brand creates digital content based on the events and activities in-store and publishes them online, generating further hype on social media. The unique in-store experience generates excitement and anticipation, driving demand and traffic online and offline, and creating customer affiliation with the Culture Kings brands, not just the products sold.

Petal & Pup: Founded in Australia in 2015, Petal & Pup joined the a.k.a. Brands platform in August 2019. The brand operates exclusively online and offers an assortment of trendy, flattering, feminine styles and dresses for special occasions. The brand targets female customers typically in their 20s or 30s, with more than half of customers in the 18-34-year-old age bracket. In 2019, Petal & Pup expanded to the United States, which is now its fastest growing geography.
mnml: Founded in Los Angeles in 2016, mnml joined the a.k.a. Brands platform in October 2021. mnml is a high-growth men’s streetwear brand that designs premier, fashion forward apparel at affordable prices. As an early mover in the DTC streetwear segment, mnml has created powerful brand recognition and is an established destination for modern wardrobe staples, current trends and highly sought-after styles. The brand has developed a data-driven merchandising model to bring quality, on-trend fashion to customers faster and at an accessible price point. mnml’s authentic social media marketing strategy, highlighted by its more than one million followers across social platforms, drives efficient customer acquisition and strong brand loyalty.
Rebdolls: Founded in New Jersey in 2014, Rebdolls joined the a.k.a. Brands platform in December 2019. The brand offers apparel with a full range of sizes from 0 to 32 with an emphasis on size inclusivity. Rebdolls targets the underserved market of diverse, plus-sized women and believes that now more than ever the world needs more diversity in fashion. The typical Rebdolls customer is a diverse woman between the ages of 18 and 34.
Merchandising
Our brands offer a broad yet curated assortment of clothing, footwear, headwear and accessories. Collectively, we serve both female and male customers who wear our products for a wide range of occasions. A high proportion of our offerings, or over 47% in 2021 across a.k.a. Brands, are proprietary and exclusive. Owned brand offerings represented 71% of total net revenues in 2021 and typically delivers a higher gross margin than that of third-party brands. The range and exclusivity of our offerings serve the diverse needs of our customers, generate excitement and promote loyalty.
Our brands utilize data analytics to inform the development and curation of on-trend fashion offerings. We work with a network of suppliers to achieve rapid speed-to-market. For example, Princess Polly collects and analyzes data on purchasing patterns, conversion rates and social media signals to quickly identify best-selling products and new potential product trends in the market. The brand then makes small initial purchases of inventory and observes market signals before quickly replenishing selective winning styles often “in season” to further capitalize on their popularity. This model has also been adopted by Petal & Pup since 2020 and is being implemented for Culture Kings, mnml and Rebdolls.
In addition, the global and dual-hemisphere presence of our brands allow us the flexibility to leverage the geographic advantages inherent in our platform, including the offsetting seasons across hemispheres. We have the capability to monitor and identify emerging trends in each market and season, and then quickly introduce them across geographies. Additionally, we stock inventory in both Australia and the U.S., which enables us to carry relevant, in-season merchandise. We have the ability to manage end-of-season inventory by shipping across markets where the merchandise is in-season, enhancing our inventory productivity and further encouraging full price sell through.
Sourcing
We source our products from a network of international suppliers. Our supplier base includes approximately 267 suppliers across 8 different countries as of December 31, 2021.
We have strong long-term relationships with our manufacturers, but we do not have any long-term commitments requiring us to purchase minimum volumes from any supplier or manufacturer. We seek to leverage our collective scale and use the same suppliers for our brands, where possible, in order to obtain more favorable terms from our suppliers. Our network of third party suppliers allows us to be capital efficient and nimble, giving us the ability to move new designs we receive from our suppliers into production and then into inventory in as few as 30-45 days, as compared to up to 9 months for traditional apparel brands.
We strategically establish sourcing relationships to ensure a constant supply of high quality, low cost inventory with a number of our suppliers exclusively manufacturing for our brands. Although we have our own design team, a number of suppliers have the capability to produce concepts and designs with no obligation for our brands to purchase. With less seasonal demand for our products, we offer our manufacturing partners predictable and consistent growth in inventory purchases throughout the year.
Customer Experience
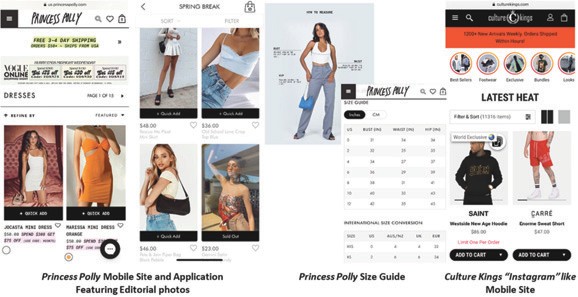
A vast majority of our customers shop through our websites and mobile sites. Our websites and native mobile applications are designed to offer convenient navigation and feature editorial product pictures which facilitate product discovery and selection. Our brands’ websites and mobile platforms are based on responsive web design principles, which aim to make web pages render well on a variety of devices and window or screen sizes. These websites and mobile platforms employ technologies to create a compelling, easy-to-use shopping experience for our consumers.
Due to the high proportion of proprietary and exclusive products, we are able to standardize the sizing of our products, thereby providing better size consistency for customers. Our brands offer an interactive sizing tool and fit guides for customers, reducing the need to purchase the same styles in multiple sizes and returning the products that do not fit. Culture Kings and mnml serve customer bases consisting of primarily male customers, who tend to return merchandise less frequently. Across a.k.a. Brands, our return ratio was approximately 14% in fiscal year 2021, compared to the eCommerce average of approximately 30% according to Invesp, a consultancy specializing in conversion rate optimization, driving convenience for customers and cost savings on shipping and logistics for a.k.a.
We foster customer loyalty by offering a convenient customer experience and customer care services throughout the initial transaction, fulfillment, shipping and return processes. We have ten fulfillment centers and warehouses, five in Australia and five in the United States. Our customer service team, who interact with our customers primarily through email or instant-message, addresses questions relating to orders, deliveries and returns, and also answers questions regarding fit, color, size and other style matters to ensure customer satisfaction. Across our five websites, customers can use multiple payment methods and pay in multiple currencies. While we do not extend direct credit to our customers, we do offer third-party payment alternatives that allow our customers to make installment payments. Our inventory tracking system enables our customers to receive real-time updates regarding the status of their orders. We offer excellent customer service, fast shipping and easy returns to all of our customers and our efficient operations allow us to send a high percentage of orders on the same day, subject to certain cut-off times being met. For shipping to and from certain countries, we have worked with our delivery partners to create dedicated “shipping lanes” that have resulted in faster service and lower costs. We are also able to ship to and service customers almost anywhere in the world.
Our Marketing Approach
We grow brand awareness, acquire new customers and drive traffic through a combination of brand and performance marketing strategies which generate traffic through both unpaid and paid sources.
Brand Marketing
Our brands seek to create an authentic voice that resonates with our customers. We update our websites and social channels daily with a consistent flow of fresh and authentic editorial content created by our in-house team and our network of influencers to engage our customers and drive online traffic. We aim to be an early adopter of social media channels that our customers engage with by quickly adapting marketing strategies and producing channel-specific content. To date, we have built a community of over 8.7 million followers across multiple social media channels, including Instagram, Facebook, YouTube and TikTok.
Princess Polly partners with an extensive network of approximately 11,000 influencers globally. The brand focuses on influencers with small and mid-sized followings, who tend to have an emotional connection with our brand and feature our products in an authentic way that resonates with our customers. In some cases, the brand partners with emerging influencers to create dedicated content for them to publish to their audience. The brand monitors the performance and effectiveness of its influencer network. We believe our influencer strategy not only creates a deeper relationship with our customers, but also diversifies the potential risk associated with individual celebrity or macro influencer endorsements. Leveraging learnings from Princess Polly, Culture Kings also began its own social media marketing program recently and has achieved early success.
Core to Culture Kings marketing strategy is their digital content and social media strategy surrounding their eight highly experiential retail stores in Australia and New Zealand. The stores feature a variety of public events and host creative activities that combine music, sports, art and fashion to engage our customers. The digital content created of the in-store events and gamification is piped out over social media, generating buzz and driving online traffic. We believe this event-driven and social media-led strategy cultivates a unique emotional connection and viral hype directly with the Culture Kings brand, not just the products it sells. Based on an internal customer survey conducted in November 2020, approximately 40% of Culture Kings customers in Australia made their first purchase after visiting a retail store.
Our recently introduced VIP and Loyalty programs focus on customer retention and drive increased customer lifetime value. Princess Polly’s loyalty program has already attracted over 1.4 million members since it launched in 2020. Through these programs we communicate directly with our top customers, providing them an exclusive experience with unique discounts, incentives, early product look features and access to events.
Unpaid Marketing
Our unpaid marketing sources can be characterized in two categories, organic and free channels. Organic traffic, which accounts for more than 60% of total traffic, is driven by direct traffic to our brands’ websites as well as customer discovery of our brands through organic search, our social media accounts and word of mouth, including other customers’ unpaid promotion of our brands on their social media accounts. We also generate traffic through other unpaid sources, which we characterize as free marketing, including personalized email marketing, SMS and mobile “push” communications through our apps. In 2021, unpaid traffic accounted for approximately 62% of total traffic.
Performance Marketing
While brand marketing is central to our marketing strategy, approximately 70-75% of our marketing expense is devoted to performance marketing efforts. We acquire and retain customers through retargeting, paid search/product listing ads, affiliate marketing and paid social. At Culture Kings, our Google analytics strategy allows us to efficiently list highly anticipated product drops. This strategy drives customer acquisition while we then largely focus retention efforts through our other marketing channels.
Our Technology Infrastructure
Our next-generation brands are built on a modern, flexible and scalable technology infrastructure which leverages a broad network of best-in-class, third-party technology providers. We then combine that customized presentation layer with the backend engine from Shopify, which is a proven and industry leading eCommerce solution. By pairing our own in-house technology with cloud software, we have been able to create a truly differentiated user experience that we can adjust as necessary while also leveraging engineering talent from some of the best SaaS companies in the world to scale rapidly and efficiently. Our cloud-based, SaaS native strategy allows us to adopt innovative, dynamic technology and capabilities with limited upfront investment and nimbly adopt market-leading technologies as they are introduced. We consider this to be a key differentiating factor compared to traditional retail proprietary technology stacks and for which switching to a more agile cloud-based SaaS solution could be too costly and risky.
Our technology infrastructure integrates seamlessly across our organization, connecting in a way that allows constant iteration and improvement. We leverage highly customizable solutions to provide customers optimal improved experiences, while limiting the costs and time required of custom bespoke solutions. This approach allows us to easily test new capabilities on a limited and low-cost basis, analyze and learn from the results, and then roll out more broadly if successful. We are leveraging our technology infrastructure to accelerate our scale and growth and drive efficiencies in areas spanning marketing, merchandising, customer experience, supply chain, operations and administration.
People & Culture
We promote a holistic approach to building our team and have created a culture that is inclusive, diverse and high performing. We seek out and hire team members who bring specialized, functional expertise while able to collaborate effectively across brands, functions and geographies. Our culture is fast-paced, promotes accountability, empowers team members to drive the business forward daily, stresses a bias toward action and embraces the individuality of each team member.
Attracting, motivating and retaining passionate talent at all levels is vital to continuing our success. We actively look for talented people across multiple geographies and promote a “work from anywhere” approach, which allows us to maintain a lean physical footprint and employ offices as team collaboration hubs. We continuously work to improve the team member experience to drive retention and engagement. None of our employees are represented by a labor union or covered by a collective bargaining agreement. Our culture incents and rewards passionate, creative and results-oriented employees.
As of December 31, 2021, across a.k.a. Brands, we had more than 1,100 full-time employees. The majority of our workforce is located in Australia, with the remaining employees located throughout the United States. On a limited basis, we may use temporary personnel to supplement our workforce as business needs arise.
Competition
The online and offline retail markets generally are highly competitive and rapidly evolving. We face significant competition from eCommerce websites, including apparel- and accessories-oriented eCommerce websites as well as the eCommerce websites of traditional retailers. We also face competition from in-person stores and boutiques, including traditional retailers and fashion boutiques.
We compete based on product selection, differentiation, exclusivity, brand quality and strength of customer relationships, relevance, convenience, ease of use and consumer experience, including order fulfillment and shipping timelines. We believe we compete favorably across these factors taken as a whole.
Seasonality
We typically achieve our largest quarterly revenues in the fourth fiscal quarter. In fiscal year 2021, our net revenues in the first, second, third and fourth quarters represented 12%, 27%, 29% and 32%, respectively, of our total net revenues for the year. In fiscal year 2020, our net revenues in the first, second, third and fourth quarters represented 16%, 22%, 29% and 33%, respectively, of our total net revenues for the year. Revenues are typically higher during the months of November and December driven by higher holiday season spending.
Intellectual Property
We primarily protect our intellectual property through the trademark, copyright and trade secret laws of Australia and the United States. As of December 31, 2021, we owned approximately 470 trademark registrations, approximately 15 trademark applications and approximately 83 Internet domain names. Although we have not sought copyright registration for our technology or works to date, we rely on common law copyright and trade secret protections in relation to our proprietary technology, products and the content displayed on our websites, including our photography and fabric prints that we design. Our trademarks, including domain names, are material to our business and brand identity.
In addition to the protections provided by our intellectual property rights, we enter into confidentiality agreements with our employees, consultants, contractors and business partners. We further control the use of our technology and intellectual property through provisions in both our client terms of use on our website and in our vendor terms and conditions.
Sustainability and Responsible Fashion
a.k.a. Brands promotes sustainable, responsible and inclusive fashion and does so by focusing on four key areas: ethical sourcing, sustainable products, protecting the planet and equality and community.
Ethical sourcing: we aim to promote a safe and respected environment for workers who make our products and protect their human rights. For example, in 2021 Princess Polly became a participant of the United Nations Global Compact, and aligned our Earth Club mission with the United Nations Sustainable Development Goals (SDGs). Princess Polly’s program is built on 6 dimensions (Human Rights Policy, Code of Conduct, Ethical Sourcing Guidelines, Child and Force Labour Policy, Manufacturing and Packaging Guidelines, and Animal Welfare Policy), and aims to create adherence with suppliers and awareness with customers. Princess Polly requires all suppliers to adhere to its Human Rights Policy and requires all production factories to register with the Supplier Ethical Data Exchange (SEDEX). We work closely with our manufacturing partners to ensure a high standard of working conditions. Currently, 100% of Princess Polly products are produced in factories that have a valid SEDEX Members Ethical Trade audit. Princess Polly is the leader in our portfolio on sustainability, and we will leverage their best practices and apply them to the rest of our portfolio. We are devoted to making continual progress towards our commitments and being transparent along the way.
Sustainable products: we design products that put people, animals and the planet first. To that end, we aim to use sustainable materials for our products. At Princess Polly we use six main materials in all products including polyester, cotton, viscose, metals, nylon and acrylic. We are committed to working with our supply chain to source lower-impact alternatives for each of these materials, and to certify our factories to create lower-impact products. As part of this initiative, in February 2021 we released our first Princess Polly Earth Club Edit made from lower-impact materials, including organically grown cotton and recycled polyurethane. We are aiming to have over 40% of our products made with lower-impact materials by the end of 2022.
Protect the planet: by promoting circularity and improving the environmental impact of our packaging, business operations and factories. Our business model limits waste generation in our supply chain. Our real-time, demand-driven and automated ordering system allows production to track demand as accurately as possible. This high velocity, low wastage strategy allows us to avoid wastefulness.
Equality and community: We are committed to instilling an inclusive culture and promoting diversity across our brands. As such, we aim to represent the diversity of our customers in our marketing and offer the right product to serve their unique demand. Our brands Rebdolls, Culture Kings address the traditionally underserved yet fast-growing markets of plus-size female and men’s fashion, respectively. Rebdolls carries sizes 0 to 32 and approximately 70% of its customers are Black. 56% of Culture Kings’ customers are men.
Government Regulation
Our business is subject to a number of domestic and foreign laws and regulations that affect companies conducting business on the Internet, many of which are still evolving and could be interpreted in ways that could harm our business. These laws and regulations include federal and state consumer protection laws and regulations (including the General Data Protection Regulation in the European Union), which address, among other things, the processing of payments, privacy, data protection, information security, sending of commercial email and other laws regarding unfair and deceptive trade practices. We are also subject to laws and regulations governing the accessibility of our websites, including under the Americans with Disabilities Act.
Our business is also subject to additional laws and regulations, including restrictions on imports from, exports to, and services provided to persons located in certain countries and territories, as well as foreign laws and regulations addressing topics such as advertising and marketing practices, customs duties and taxes and consumer rights, any of which might apply by virtue of our operations in foreign countries and territories or our contacts with consumers in such foreign countries and territories.
In addition, apparel, shoes and accessories sold by us are also subject to regulation by governmental agencies in Australia, New Zealand and the United States, as well as various other federal, state, local and foreign regulatory authorities. These laws and regulations principally relate to the materials, proper labeling, advertising, marketing, manufacture, licensing requirements, flammability testing, safety, shipment and disposal of our products. We are also subject to laws, rules and regulations relating to the operations of our stores and warehouses.
We are also subject to environmental laws, rules and regulations. Similarly, apparel, shoes and accessories sold by us are also subject to import regulations in the United States and other countries concerning the use of wildlife products for commercial and non-commercial trade. We do not estimate any significant capital expenditures for environmental control matters either in the current fiscal year or in the near future.
For more information about laws and regulations applicable to our business, see “Risk Factors–Risks Relating to Laws and Regulation.”
ITEM 1A. RISK FACTORS
Investing in our common stock involves a number of risks. Before you purchase our common stock, you should carefully consider the risks described below and the other information contained in this Annual Report on Form 10-K, including our condensed consolidated financial statements and accompanying notes. If any of the following risks actually occurs, our business, prospects, financial condition, results of operation or cash flows could be materially adversely affected and the factors that we identify as risks to a particular aspect of our business could materially affect another aspect of our business or the company as a whole. The risks below are not the only risks we face. Additional risks and uncertainties not currently known to us or those we currently view to be immaterial may also materially affect our business, prospects, financial condition, results of operation or cash flows. In any such case, the trading price of our common stock could decline, and you could lose all or part of your investment.
Summary of Risk Factors
Our business is subject to numerous risks and uncertainties that you should consider before investing in our common stock. The following is a summary of some of these risks and uncertainties. This summary should be read together with the more detailed description of each risk factor below.
•The recent coronavirus (COVID-19) global pandemic has adversely affected, and could in the future
materially adversely affect, our business, financial condition and results of operations;
•Rapidly-changing consumer preferences in the apparel, footwear and accessories industries expose us to the risk of lost sales, harmed customer relationships and diminished brand loyalty if we are unable to anticipate such changes;
•Our future revenues and operating results will be harmed if we fail to acquire new customers, retain existing customers, and maintain average order value levels;
•We face risks related to our growth strategy if we are unsuccessful in identifying brands to acquire, integrate and manage on our platform;
•Our business and the success of our products could be harmed if we are unable to maintain our corporate integrity or the images and reputations of our brands;
•Economic downturns and market conditions could materially adversely affect our business, operating results, financial condition and growth prospects;
•Our use of third-party suppliers and manufacturers that are primarily based in China exposes us to risks inherent in doing business there;
•We face risks to our operating results if we fail to manage our inventory effectively;
•Increases in labor costs, including wages, and transportation costs could adversely affect our business, financial condition and results of operations;
•We may not realize all of the anticipated benefits of the Culture Kings acquisition in the expected time frame or at all;
•Changes in laws or regulations relating to data privacy and security that are applied adversely to us may have a material adverse effect on our reputation, results of operations, financial condition and cash flows; and
•Changes in accounting standards and subjective assumptions, estimates and judgments by management related to complex accounting matters could significantly affect our financial results or financial condition.
Risks Relating to COVID-19
The coronavirus (COVID-19) global pandemic has caused, and may continue to cause significant disruption in our industry, which has and may continue to materially impact our business, financial condition and results of operations.
Our business has been, and may continue to be, impacted by the effects of the COVID-19 global pandemic, including as a result of new variants. The pandemic significantly increased economic and demand uncertainty globally and caused record levels of unemployment in the U.S. and abroad. The economic uncertainty of the COVID-19 pandemic has led to volatility in consumer spending and a decrease in consumer confidence. Our revenue, results of operations and cash flows depend on the overall demand for our product.
We believe that the volatility of consumer demand during the pandemic was mitigated in part by the stay-at-home restrictions imposed in connection with the COVID-19 pandemic and the temporary closures of many traditional brick-and-mortar stores, which we believe shifted consumer spending patterns towards online retailers like us. As the offline economy continues to reopen and governmental and other restrictions on movement and travel lessen, we may not continue to benefit from this trend toward online shopping. It is difficult to ascertain with precision how much of our growth is attributable to the impact of those stay-at-home restrictions, and there can be no assurances that these positive trends during the COVID-19 pandemic will be sustained through the remainder of the pandemic or in the future. If the positive impacts of the COVID-19 pandemic on our business are not sustained through the remainder of the pandemic or in the future, or if customers’ purchases decline more than expected, our results of operations would be adversely impacted.
In addition, some of our customers have experienced and may continue to experience financial hardships, which may adversely impact demand for our products. Mandates from governmental authorities abroad, including in Australia and China, to close businesses, limit travel and transportation, avoid large gatherings or to self-quarantine, as well as temporary closures and decreased operations at our suppliers’ facilities, have negatively impacted our business and may continue to negatively impact our business in the future, and statements by certain governmental authorities suggest that such mandates may continue to reoccur for an indefinite period of time. Approximately 39% and 31% of our net sales for the years ended December 31, 2021 and 2020, respectively, were derived from sales to customers in Australia. Our third-party suppliers and manufacturers are based primarily in China, which has imposed and we believe will continue to impose widespread business closures in connection with the COVID-19 pandemic. As a result, any ongoing mandates in Australia and China in particular could adversely impact our results of operations.
During the COVID-19 pandemic, we have implemented a number of measures designed to protect the health and safety of our workforce and position us to maintain our healthy financial position. These measures include restrictions on non-essential business travel, the institution of work-from-home policies and the implementation of strategies for workplace safety at our offices and facilities. We are following the guidance from public health officials and government agencies with respect to such facilities, including implementation of enhanced cleaning measures and social distancing guidelines.
We may continue to incur increased costs for our operations during this pandemic that are difficult to predict with certainty. As a result, our business, results of operations, cash flows or financial condition may be affected and could continue to be adversely impacted in the future. There is no assurance the measures we have taken or may take in the future will be successful in managing the uncertainties caused by the COVID-19 pandemic. Governmental measures to try to contain the virus have impacted and may further impact all or portions of our workforce and operations, the behavior of our customers and the operations of our respective suppliers. There is no certainty that measures taken by us or by governmental authorities will be sufficient to mitigate the risks posed by the COVID-19 pandemic, and our ability to perform critical functions could be harmed.
The future impact of the COVID-19 pandemic will depend on a number of factors, which are highly uncertain and cannot be predicted, including, but not limited to, the duration of the pandemic, the resurgence of cases, the acceptance and effectiveness of vaccines, new variants, effects of the outbreak on our customers and suppliers and the measures adopted by local and federal governments. To add to the uncertainty, the nature and rate of any economic recovery and any ongoing effects on consumer demand and spending patterns is unclear. For instance, any increases in consumer discretionary spending related to government stimulus programs may be temporary, and consumer spending may decrease again if the government does not continue such stimulus programs. All of these factors could have a negative impact on our revenue, cash flows and results of operations and could have the effect of heightening many of the other risks described in this “Risk Factors” section.
Risks Relating to Our Business and Strategy
The apparel, footwear and accessories industries are subject to rapid changes in consumer preferences, and if we do not accurately anticipate and promptly respond to changes in consumer preferences, we could lose sales, our relationships with customers could be harmed and our brand loyalty could be diminished.
The apparel, footwear and accessories industries are subject to rapid changes in consumer preferences and tastes, which can make it difficult to anticipate demand for our products and forecast our financial results. We believe there are many factors that may affect the demand for our products, including:
•seasonality, including the impact of anticipated and unanticipated weather conditions;
•consumer acceptance of our existing products and acceptance of our new products, including our ability to develop new products that are private label or exclusive;
•consumer demand for products of our competitors;
•consumer perceptions of and preferences for our products and brands, including as a result of evolving ethical or social standards;
•the extent to which consumers view certain of our products as substitutes for other products we manufacture;
•publicity, including social media, related to us, our products, our brands, our marketing campaigns and our influencer endorsers;
•the life cycle of our products and consumer replenishment behavior;
•evolving fashion and lifestyle trends, and the extent to which our products reflect these trends;
•brand loyalty; and
•changes in consumer confidence and buying patterns, and other factors that impact discretionary income and spending.
Consumer demand for our products depends in part on brand loyalty and the continued strength of our brands, which in turn depend on our ability to anticipate, understand and promptly respond to the rapidly changing preferences and fashion tastes for apparel, footwear and accessories, as well as consumer spending patterns. As our brands and product offerings continue to evolve, it is necessary for our products to appeal to an even broader range of consumers whose preferences cannot be predicted with certainty. For example, many of our products include a fashion element and could go out of style quickly. Furthermore, we are dependent on consumer receptivity to our new products and to the marketing strategies we employ to promote those products. Consumers may not purchase new models and styles of apparel, footwear and accessories in the quantities projected or at all. If we fail to predict or react appropriately to changes in consumer preferences and fashion trends or fail to adapt to shifting spending patterns or demand, consumers may consider our brands and products to be outdated or unattainable or associate our brands and products with styles that are no longer popular, which may adversely affect our overall financial performance.
If we fail to acquire new customers, or fail to do so in a cost-effective manner, we may not be able to increase net sales or maintain profitability.
Our success depends on our ability to acquire customers in a cost-effective manner. In order to expand our customer base, we must appeal to and acquire customers who have historically used other means of commerce in shopping for apparel and may prefer alternatives to our offerings, such as traditional brick-and-mortar retailers or the websites of our competitors. If we fail to deliver a quality online experience, or if consumers do not perceive the products we offer to be of high value and quality, we may not be able to acquire new customers. Our marketing strategy includes using social media platforms as marketing tools and maintaining relationships with social media influencers. As social media platforms continue to rapidly evolve and new platforms develop we must continue to maintain a presence on these platforms and establish a presence on new or emerging social media platforms. If marketing through social media influencers becomes less effective at engaging new customers, our ability to drive new growth may be negatively impacted, and marketing costs may increase materially, which would negatively impact sales and margins. We also seek to engage with our customers and build awareness of our brands through sponsoring unique events and experiences. These events may fail to promote awareness of our brands and products and may not generate a meaningful return on investment.
We also acquire and retain customers through retargeting, paid search and product listing ads, affiliate marketing, paid social, personalized email marketing, SMS text and mobile “push” communications through our mobile apps. Search engines frequently change the algorithms that determine the ranking and display of results of a user’s search and may make other changes to the way results are displayed, or may increase the costs of advertising, which can negatively affect the placement of our links and, therefore, reduce the number of our visits to our websites and social media channels, or make such marketing cost prohibitive. In addition, social media platforms typically require compliance with their privacy policies, which may be subject to change or new interpretation with limited ability to negotiate. If we are unable to cost-effectively use on-line marketing tools or if the social media platforms we use change their policies or algorithms, we may not be able to cost-effectively drive traffic to our websites, and our ability to acquire new customers could suffer. Conversely, if these on-line marketing tools are successful in driving traffic to our sites, they could cause the “runaway promo code effect” of pricing and promotional errors that are amplified by the wide dissemination to a larger consumer audience, which could adversely impact our operating results. If our marketing efforts are not successful in promoting awareness of our brands and products, driving customer engagement or attracting new customers, or if we are not able to cost-effectively manage our marketing expenses, our operating results will be adversely affected.
If we fail to retain existing customers, or fail to maintain average order value levels, we may not be able to maintain our revenue base and margins, which would have a material adverse effect on our business and operating results.
A significant portion of our net sales are generated from sales to existing customers, particularly those existing customers who are highly engaged and make frequent purchases of the merchandise we offer. If existing customers no longer find our offerings appealing, or if we are unable to timely update our offerings to meet current trends and customer demands, our existing customers may make fewer or smaller purchases in the future. A decrease in the number of our customers who make repeat purchases or a decrease in their spending on the merchandise we offer could negatively impact our operating results. Further, we believe that our future success will depend in part on our ability to increase sales to our existing customers over time, and if we are unable to do so, our business may suffer. If we fail to generate repeat purchases or maintain high levels of customer engagement and average order value, our growth prospects, operating results and financial condition could be materially adversely affected.
Our business depends on effective marketing and high customer traffic.
We have many initiatives in our marketing programs particularly with regard to our websites, mobile applications and our social media presence. If our competitors increase their spending on marketing, if our marketing expenses increase, if our marketing becomes less effective than that of our competitors, or if we do not adequately leverage technology and data analytics capabilities needed to generate concise competitive insight, we could experience a material adverse effect on our results of operations. Among other factors, (1) a failure to sufficiently innovate or maintain effective marketing strategies and (2) U.S. and foreign laws and regulations that make it more difficult or costly to digitally market, such as the European Union General Data Protection Regulation (“GDPR”) and the California Consumer Privacy Act of 2018 (“CCPA”), may adversely impact our ability to maintain brand relevance and drive increased sales.
Merchandise returns could harm our business.
We allow our customers to return products, subject to our return policy. If the rate of merchandise returns increases significantly or if merchandise return economics become less efficient, our business, financial condition and operating results could be harmed. Further, we may modify our policies relating to returns from time to time, which may result in customer dissatisfaction or an increase in the number of product returns. From time to time our products are also damaged in transit, which can increase return rates and harm our brand.
We may be unsuccessful in identifying brands to acquire and in integrating and managing our acquisitions and investments to expand the number of brands on our platform.
We have acquired five businesses to date, and we intend to acquire or invest in additional companies to increase the number of brands in our platform. Any such business acquisitions and investments could be significant and could have a material impact on our business, financial condition and results of operations. We regularly identify and evaluate potential business acquisitions and investments, and we typically have a pipeline of acquisition and investment opportunities of different stages of evaluation. There are numerous risks associated with our acquisition strategy, including:
•our inability to identify appropriate candidates for acquisition;
•competition for acquisition targets driving up purchase prices;
•disruption of our ongoing business, including loss of management focus on existing businesses;
•problems retaining key personnel;
•unanticipated operating losses and expenses of the businesses we acquire or in which we invest;
•risks of losing a target company’s customer and other relationships;
•the difficulty of completing acquisitions or investments and achieving anticipated benefits within expected timeframes, or at all;
•the difficulty of integrating acquired brands on our platform, and unanticipated expenses related to their integration;
•the difficulty of integrating another company’s accounting, financial reporting, management, information and data security, human resource and other administrative systems to permit effective management, and the lack of control if such integration is delayed or not successfully implemented;
•losses we may incur as a result of declines in the value of an acquisition or an investment or as a result of incorporating its financial performance into our financial results, and our dependence on its accounting, financial reporting, systems, controls and processes;
•the risks associated with businesses we acquire or invest in, which may differ from or be more significant than the risks our existing businesses face;
•potential unknown, unidentified or undisclosed liabilities or risks associated with a company we acquire or in which we invest; and
•for foreign transactions, additional risks related to the integration of operations across different cultures and languages, and the economic, political and regulatory risks associated with specific countries.
We are evaluating multiple opportunities for such acquisitions in the near term. We are not party to any definitive agreements in respect of any such acquisition targets, but it is possible discussions relating to one or more of these potential acquisitions could advance and it is possible we could sign or complete any such transactions shortly after we complete this filing. We cannot assure you that we will become a party to any definitive agreements to consummate a transaction, or that if we do become a party to such agreements that we will be able to close the transactions and acquire the relevant target company.
In order to fund future acquisitions or investments, we expect need to issue additional equity securities, spend our cash or incur debt, which may only be available on unfavorable terms, if at all. Any such financing to fund future acquisitions or investments may change our leverage profile, potentially significantly.
In addition, any shares of our common stock or other equity linked securities that we issue in connection with an acquisition or investment could constitute a material portion of our then-outstanding shares of common stock, which could adversely affect the price of our common stock and result in significant dilution to your ownership interest. In addition, valuations supporting our acquisitions and strategic investments could change rapidly. We could determine that such valuations have experienced impairments or other-than-temporary declines in fair value which could adversely impact our financial results. We may record contingent liabilities and amortization expenses related to intangible assets as a result of acquisitions. Our growth prospects are dependent on our ability to identify and acquire additional brands and integrate them on our platform, and our failure to do so may negatively impact our future growth and, as a result, our results of operations.
We may not succeed in our growth strategy.
One of our key strategic objectives is growth, which we pursue organically and through acquisitions. In particular, we seek to grow by attracting new fashion brands to our platform, winning new customers to expand our market share, marketing our brands in new regions, building on economies of scale, leveraging our supply chain and information technology capabilities across our company, expanding our direct-to-consumer business and growing our eCommerce business. However, we may not be successful in growing our business. For example:
•we may have difficulty completing acquisitions to expand our platform, and we may not be able to successfully integrate a newly acquired business or achieve the expected growth, cost savings or synergies from such integration, or it may disrupt our current business;
•we may not be able to continue to evolve to meet our customers’ changing needs and expectations, and our existing customers may reduce their purchases of our products;
•we may not successfully expand our market share by winning new customers;
•our brands may not be widely accepted in new countries or regions;
•we may have difficulty recruiting, developing or retaining qualified employees;
•we may not be able to manage our growth effectively, adapt our business model or develop relationships with customers or successfully operate our recently acquired Culture Kings stores;
•we may not be able to scale the abilities of our supply chain operations to meet increased consumer demand, and we may not be able to offset rising materials, procurement and shipping costs with pricing actions or efficiency improvements;
•any new brands we acquire might cannibalize our existing brands and cause a decrease in sales of our existing brands; and
•we may not be able to complete dispositions of nonstrategic assets in the future.
We are also required to manage numerous relationships with various suppliers, vendors and other third parties. Changes in our suppliers, vendor base, distribution centers, information technology systems or internal controls and procedures may not be adequate to support our operations. If we are unable to manage the growth of our organization effectively, our business, financial condition and operating results may be adversely affected. If we fail to continue to develop and grow our business, our financial condition and results of operations and the value of your investment may be materially adversely affected.
Our growth plan contemplates expansion into new markets, and our efforts to expand may ultimately be unsuccessful.
Our growth plan includes introducing our brands globally, including in countries and regions where we have no or limited operating experience. Expanding into new countries and regions involves significant risk, particularly if we have no experience in marketing, selling and engaging with customers in the market. For example, there is no guarantee that the success of a brand in Australia will translate to the success of that brand in other countries, such as the U.S. Our efforts to expand into new countries and regions could fail for many reasons, including our failure to accurately or timely identify apparel trends in new markets, different consumer demand dynamics and lack of acceptance of new offerings by existing or new users, our failure to promote the new markets effectively or negative publicity about us or our new markets. In addition, these initiatives may not drive increases in revenue, may require substantial investment and planning and may bring us more directly into competition with companies that are better established, operate more effectively or have greater resources than we do. There is additional complexity associated with local laws, tariffs and shipping logistics in new countries where our brands do not have an established presence. Expanding into new markets will require additional investment of time and resources of our management and personnel. If we are unable to cost-effectively expand into new countries and regions, then our growth prospects and competitive position may be harmed and our business, results of operations, and financial condition may suffer.
We face risks from our international business.
Our current growth strategy includes plans to expand our digital marketing and grow our eCommerce and retail presence internationally over the next several years. As we seek to expand internationally, we face competition from more established retail competitors. Consumer demand and behavior, as well as cultures, and tastes and purchasing trends, may differ, and as a result, sales of our merchandise may not be successful, or the margins on those sales may not be in line with our expectations. Our ability to conduct business internationally may be adversely impacted by geopolitical (such as the recent outbreak of hostilities between Russia and Ukraine), economic, and public health events, such as the COVID-19 pandemic, the manner in which governments respond to such events, as well as the global economy. Any challenges that we encounter as we expand internationally may divert financial, operational and managerial resources from our existing operations, which could adversely impact our financial condition and results of operations.
We face risks associated with the potential uncertainty and disruptions relating to the United Kingdom’s withdrawal from the European Union (“Brexit”), including the risk of additional regulatory and other costs and challenges or limitations on our ability to sell particular products. In particular, these uncertainties may affect the viability of our operations through compliance with changing regulatory and disclosure requirements, re-determining our importation policies, and regulations regarding subsidies of consumer-facing taxes. Although the United Kingdom and the European Union negotiated a post-Brexit trade agreement, which went into effect on January 1, 2021, the ongoing uncertainty surrounding Brexit could have a material adverse effect on our business (including our European growth plans), results of operations, financial condition and cash flows.
In addition, we are increasingly exposed to foreign currency exchange rate risk with respect to our revenue, profits, assets and liabilities denominated in currencies other than the U.S. dollar.
Shipping is a critical part of our business and any interruptions in, or increased costs of, shipping could adversely affect our operating results.
We currently rely on third-party vendors for our inbound and outbound customer freight. If we are not able to negotiate acceptable pricing and other terms with these vendors or they experience operational problems or other difficulties, our customers’ experience could be negatively impacted. For example, shipping delays could delay delivery of products to our customers and increase the time it takes to process customer returns. Our ability to receive inventory and ship merchandise to customers may be negatively affected by weather, fire, flood (such as the recent flood in northeastern Australia), power loss, earthquakes, public health crises such as the COVID-19 pandemic, labor disputes, acts of war or terrorism, port closures, import and export tariffs, complex local laws and other factors. Reduced air traffic during the COVID-19 pandemic resulted in reduced cargo capacity on airplanes, which intensified the demand for shipping services and increased their prices. In 2021, we also experienced meaningful delays and unpredictability with sea freight transportation, resulting in increased reliance on air freight transportation. We expect the ongoing impact of the pandemic to continue to result in reduced cargo capacity on airplanes and delayed transportation by sea, and as a result we expect increased demand and prices for shipping services to continue. While we have been able to offset increased shipping prices to some extent, there can be no assurance that we will continue to be able to do so, or that prices for shipping services will not increase to a level that does not permit us to do so. In addition, in response to the COVID-19 pandemic, we operated, and expect to continue to operate, our U.S. and Australian distribution centers at reduced capacity and limited throughput for a period of time, which puts more pressure on delivery times. In the past, strikes at and closures of major international shipping ports have impacted our supply of inventory from our vendors. We are also subject to risks of damage or loss during delivery by our shipping vendors. If our merchandise is not delivered in a timely manner or is damaged or lost during the delivery process, our consumers could become dissatisfied and cease purchasing our products, which would adversely affect our business and operating results.
Our direct-to-consumer business model is subject to risks that could have an adverse effect on our results of operations.
We sell merchandise direct-to-consumer through our eCommerce sites. Our direct-to-consumer business model is subject to numerous risks that could have a material adverse effect on our results. Risks include, but are not limited to, (i) resellers purchasing private label and exclusive merchandise and reselling it outside of authorized distribution channels, (ii) failure of the systems that operate our eCommerce websites, and their related support systems, including computer viruses, (iii) theft of customer information, privacy concerns, telecommunication failures and electronic break-ins and similar disruptions, (iv) credit card fraud and (v) risks related to our supply chain and fulfillment operations. Risks specific to operating an eCommerce business also include (i) the ability to optimize the online experience and direct eCommerce channels to consumer needs, (ii) liability for copyright and trademark infringement, (iii) changing patterns of consumer behavior and (iv) competition from other eCommerce and brick-and-mortar retailers. Our failure to successfully respond to these risks might adversely affect our sales, as well as damage our reputation and brands.
Use of social media and influencers may materially and adversely affect our reputation or subject us to fines or other penalties.
We use third-party social media platforms as, among other things, marketing tools. For example, our brands maintain Instagram, Facebook, YouTube and TikTok accounts. We also maintain relationships with many social media influencers and engage in sponsorship initiatives. As existing eCommerce and social media platforms continue to rapidly evolve and new platforms develop, we must continue to maintain a presence on these platforms and establish presences on new or emerging popular social media platforms. If we are unable to cost-effectively use social media platforms as marketing tools or if the social media platforms we use change their policies or algorithms, we may not be able to fully optimize such platforms, and our ability to maintain and acquire customers and our financial condition may suffer. Furthermore, as laws, regulations, policies governing platforms and public opinion rapidly evolve to govern the use of these platforms and devices, the failure by us, our employees, our network of social media influencers or third parties acting at our direction to abide by applicable laws, regulations and policies in the use of these platforms and devices or otherwise could subject us to regulatory investigations, class action lawsuits, liability, fines or other penalties and have a material adverse effect on our business, financial condition and operating results.
Our relationships with social media influencers and our sponsorship initiatives do not include any contractual commitments that they continue to be supportive of our brands or products, and there can be no assurance that they will continue to do so. For example, changes in fashion trends, consumer sentiment or public perceptions of our brands could adversely impact our relationships with social media influencers. Any negative publicity created by a social media influencer or participant in a sponsorship initiative who we formerly engaged or who is no longer supportive of our brands may reduce our sales, and may mean that we become more reliant on paid advertising and other paid promotions. The costs to enter into relationships with social media influencers or engage in sponsorship initiatives may also increase over time, which may also negatively impact our margins and results of operations.
In addition, an increase in the use of social media for product promotion and marketing may cause an increase in the burden on us to monitor compliance of such materials, and increase the risk that such materials could contain problematic product or marketing claims in violation of applicable regulations. For example, in some cases, the FTC has sought enforcement action where an endorsement has failed to clearly and conspicuously disclose a financial relationship or material connection between an influencer and an advertiser. We do not prescribe what our influencers post, and if we were held responsible for the content of their posts or their actions, we could be fined or forced to alter our practices, which could have an adverse impact on our business.
Negative commentary regarding us, our products or influencers who promote our brands and other third parties who are affiliated with us may also be posted on social media platforms and may be adverse to our reputation or business. Influencers with whom we maintain relationships could engage in behavior or use their platforms to communicate directly with our customers in a manner that reflects poorly on our brand and may be attributed to us or otherwise adversely affect us. Any such negative commentary could drive large-scale social movements against us, our products, or our brands and result in customer boycotts. It is not possible to prevent such behavior, and the precautions we take to detect this activity may not be effective in all cases. Consumers often value readily available information and may act on such information without further investigation and without regard to our accuracy. The harm may be immediate, without affording us an opportunity for redress or correction.
If our operating results differ significantly from our expectations or the expectations of securities analysts or investors, our stock price may decline.
If we fail to achieve our projected results or to meet the expectations of securities analysts or investors, our stock price may decline, and the decrease in the stock price may be disproportionate to the shortfall in our financial performance. Our short operating history as a holding company with a portfolio of newly acquired brands, and our continuing evolution as we acquire and integrate brands and enter new markets, may negatively affect our ability to forecast our consolidated operating results. If our future operating results are below the expectations of securities analysts or investors, or below any financial guidance we may provide to the market, our stock price may decline.
Our operating results fluctuate from period to period.
Our business experiences seasonal fluctuations in shipping rates, consumer demand, net sales and operating income, with a significant portion of net income typically realized in the spring and summer seasons. Historically, and consistent with the retail industry, this seasonality also impacts our working capital requirements, particularly with regard to inventory. Any decrease in sales or gross profit during this period, or in the availability of working capital needed in the months preceding this period, could have a more material adverse effect on our business, financial condition and results of operations than in other periods. Seasonal fluctuations also affect our inventory levels, as we usually order merchandise in advance of peak selling periods and sometimes before new fashion trends are confirmed by customer purchases. We must carry a significant amount of inventory, especially before the holiday selling periods. We must also carefully plan our inventory around Chinese New Year when inventory supply is constrained and materials and inbound freight costs are higher. If we are not successful in managing our inventory or fail to execute on our strategy, we may be forced to rely on markdowns or promotional sales to dispose of the excess inventory or we may not be able to sell the inventory at all, which could have a material adverse effect on our business, financial condition and results of operations.
Certain of our key operating metrics are subject to inherent challenges in measurement, and real or perceived inaccuracies in such metrics may harm our reputation and negatively affect our business.
We track certain key operating metrics using internal data analytics tools, which have certain limitations. In addition, we rely on data received from third parties, including third-party platforms, to track certain performance indicators. Data from both such sources may include information relating to fraudulent accounts and interactions with our sites or the social media accounts of our influencers (including as a result of the use of bots, or other automated or manual mechanisms to generate false impressions that are delivered through our sites or their accounts). We have only limited abilities to verify data from our sites or third parties, and perpetrators of fraudulent impressions may change their tactics and may become more sophisticated, which would make it still more difficult to detect such activity.
Our methodologies for tracking metrics may also change over time, which could result in changes to the metrics we report. If we undercount or overcount performance due to the internal data analytics tools we use or issues with the data received from third parties, or if our internal data analytics tools contain algorithmic or other technical errors, the data we report may not be accurate or comparable with prior periods. In addition, limitations, changes or errors with respect to how we measure data may affect our understanding of certain details of our business, which could affect our longer-term strategies. If our performance metrics are not accurate representations of the reach or monetization of our brand, if we discover material inaccuracies in our metrics or the data on which such metrics are based, or if we can no longer calculate any of our key performance metrics with a sufficient degree of accuracy and cannot find an adequate replacement for the metric, our business, financial condition and operating results could be adversely affected.
Our business and the success of our products could be harmed if we are unable to maintain our corporate integrity or the images and reputation of our brands.
Our success to date has been due in large part to the growth of our brands’ images and our customers’ connection to our brands. If we are unable to timely and appropriately respond to changing consumer demands, the names and images of our brands may be impaired. Even if we react appropriately to changes in consumer preferences, consumers may consider our brands’ images to be outdated or associate our brands with styles that are no longer popular.
In addition, brand value is based in part on consumer sentiment about merchandise quality and corporate integrity, including our ability to operate responsibly through our commitment to responsible fashion and sustainability. A perception that introducing a high volume of styles and manufacturing and selling of fast fashion at scale results in lower quality or increased textile waste, or that we are not honoring our commitment to responsible fashion, could harm our reputation. Our reputation could also be adversely affected by negative consumer perception of our sourcing concentration in particular countries.
Negative perceptions of our product quality, product design, product components or materials or customer service could harm our brand loyalty and the value of our business. The unauthorized resale of our merchandise outside of approved distribution channels, sales of counterfeit items on third-party websites and similar deviations from the brand identity could negatively affect consumers’ perception of our products and harm our reputation. In addition, negative claims or publicity regarding us, our products, our brands, our marketing campaigns, or our influencer endorsers, could adversely affect our reputation and sales regardless of whether such claims are accurate. Social media, which accelerates the dissemination of information, can increase the challenges of responding to negative perceptions or claims. In the past, many apparel companies have experienced periods of rapid growth in sales and earnings followed by periods of declining sales and losses. Our businesses may be similarly affected in the future. In addition, we have sponsorship contracts with a number of influencers and feature those individuals in our advertising and marketing efforts. Failure to continue to obtain or maintain high-quality sponsorships and endorsers could harm our business. In addition, actions taken by social media influencers or celebrity endorsers that harm their own reputations could adversely affect the images of our brands by association. If consumers begin to have negative perceptions of our brands, whether or not warranted, our brand image would become tarnished and our products would become less desirable, which could have a material adverse effect on our business.
Our brand depends on the promotion of diversity and equality and the ability to promote responsible fashion from an ethically- and sustainably-sourced supply chain. If we are unable to do so, damage to our brand and reputation could result or we may fail to expand our brand which would harm our business and results of operations.
Our customers and employees are increasingly focused on environmental, social and governance or “sustainability” practices. We will depend significantly on building and maintaining our brand and reputation for promoting diversity and equality and responsible fashion from an ethically- and sustainably-sourced supply chain to attract customers and employees and grow our business. If we are unable, for instance, to prioritize transparency among our employees, appropriately enforce fair labor practices, obtain our materials from ethical and sustainable suppliers or reduce waste, our brand and reputation could be significantly impaired, which could adversely affect our business, results of operations and financial condition. Customer values could shift faster than we are able to adjust our merchandise proposition. For example, weather impacts from global warming could continue to intensify and fuel increased customer sentiment for apparel that is more sustainably produced. While we are increasing our mix of sustainable fabrics, it may not be fast enough to keep up with a rapidly shifting customer sentiment and value system that is being accelerated by the impacts of global warming. If we are unable to evolve with our customers’ and employees’ expectations and standards, our brand, reputation and customer and employee retention may be negatively impacted.
We could be required to collect additional sales taxes or be subject to other tax liabilities that may increase the costs our consumers would have to pay for our offering and adversely affect our operating results.
In general, we have not historically collected state or local sales, use or other similar taxes in any jurisdictions in which we do not have a tax nexus, in reliance on court decisions or applicable exemptions that restrict or preclude the imposition of obligations to collect such taxes with respect to online sales of our products. In addition, we have not historically collected state or local sales, use or other similar taxes in certain jurisdictions in which we do have a physical presence, in reliance on applicable exemptions. On June 21, 2018, the U.S. Supreme Court decided, in South Dakota v. Wayfair, Inc., that state and local jurisdictions may, at least in certain circumstances, enforce a sales and use tax collection obligation on remote vendors that have no physical presence in such jurisdiction. A number of states have already begun, or have positioned themselves to begin, requiring sales and use tax collection by remote vendors and/or by online marketplaces. The details and effective dates of these collection requirements vary from state to state. While we now collect, remit and report sales tax in all states that impose a sales tax, it is still possible that one or more jurisdictions may assert that we have liability for previous periods for which we did not collect sales, use or other similar taxes, and if such an assertion or assertions were successful it could result in substantial tax liabilities, including for past sales taxes and penalties and interest, which could materially adversely affect our business, financial condition and operating results.
Economic downturns and market conditions beyond our control, including periods of inflation, could materially adversely affect our business, operating results, financial condition and prospects.
Our business depends on global economic conditions and their impact on consumer discretionary spending. Some of the factors that may negatively influence consumer spending include high levels of unemployment; higher consumer debt levels; reductions in net worth, declines in asset values and related market uncertainty; home foreclosures and reductions in home values; fluctuating interest rates and credit availability; fluctuating fuel and other energy costs; fluctuating commodity prices; inflationary pressure and general uncertainty regarding the overall future political and economic environment. Global economic conditions may continue to be uncertain, particularly in light of the impact of the COVID-19 pandemic and related responses, and the potential impacts of increasing inflation in the United States (our largest market) remain unknown, making trends in consumer demand unpredictable. Economic conditions in certain regions may also be affected by natural disasters, such as hurricanes, tropical storms, earthquakes and wildfires; other public health crises; and other major unforeseen events. Consumer purchases of discretionary items, including the merchandise that we offer, generally decline during recessionary periods, periods of inflation or periods of economic uncertainty, when disposable income is reduced or when there is a reduction in consumer confidence. Economic downturns or unstable market conditions may also cause customers to decrease their budgets, which could reduce their spending on our products and adversely affect our business, financial condition and results of operations. As we explore new countries to expand our business, economic downturns or unstable market conditions in any of those countries could result in our investments not yielding the returns we anticipate.
Our business is exposed to the risks of foreign currency exchange rate fluctuations.
Our international businesses operate in functional currencies other than the U.S. dollar. A growing percentage of our total revenues (approximately 52% in 2021) is derived from markets outside the U.S. Changes in currency exchange rates affect the U.S. dollar value of prices at which we purchase products and incur costs outside the U.S. In addition, for most of our brands, the majority of products are sourced from suppliers located in China. Changes in foreign currency exchange rates could have an adverse impact on our financial condition, results of operations and cash flows.
We are also exposed to currency translation risk because the results of our Australian businesses are generally reported in local currency, which we then translate to U.S. dollars for inclusion in our financial statements. As a result, exchange rate changes between foreign currencies and the U.S. dollar affect the amounts we record for our foreign assets, liabilities, revenues and expenses, and could have a negative effect on our financial results. We expect that our exposure to foreign currency exchange rate fluctuations will grow as the relative contribution of our non-U.S. operations increases.
We may be adversely affected by weather conditions.
Our business is adversely affected by unseasonable weather conditions. A significant portion of the sales of our products is dependent in part on the weather and is likely to decline in years in which weather conditions do not favor the use of these products. For example, periods of unseasonably warm weather in the fall or winter can lead to reduced consumer spending that negatively impacts our business, which can, in turn, negatively affect orders in future seasons. In addition, abnormally harsh or inclement weather can also negatively impact consumer spending. Any and all of these risks may have a material adverse effect on our financial condition, results of operations or cash flows.
If we fail to retain key personnel or attract additional qualified personnel, effectively manage succession or hire, develop, and motivate our employees, our business, financial condition, and operating results could be adversely affected.
Our success, including our ability to effectively anticipate and respond to changing style trends, depends in part on our ability to retain key personnel and attract additional qualified personnel for our executive team and on our merchandising, marketing and other teams.
Because of our short tenure as a holding company, our senior management team has limited history working together at a.k.a. Brands. We have also experienced changes in the composition of our senior management. We do not have long-term employment with any of our personnel, including our brand founders, and only have limited non-compete agreements for a term of fewer than three years. Senior employees have left us in the past and others may in the future, which we cannot necessarily anticipate and whom we may not be able to promptly replace. The loss of one or more of our key personnel or the inability to promptly identify a suitable successor to a key role could have an adverse effect on our business. Further, if any of our brand founders or other key personnel leave to join or create competing brands, our business may suffer additional adverse consequences. We do not currently maintain key-person life insurance policies on any member of our senior management team or other key employees.
We also face significant competition for personnel. To attract top talent, we have had to offer, and believe we will need to continue to offer, competitive compensation and benefits packages before we can validate the productivity of those employees. We may also need to increase our employee compensation levels in response to competition. We cannot be sure that we will be able to attract, retain and motivate a sufficient number of qualified personnel in the future, or that the compensation costs of doing so will not adversely affect our operating results. In addition, we may not be able to hire new employees quickly enough to meet our needs. If we fail to effectively manage our hiring needs or successfully integrate new hires, our efficiency, ability to meet forecasts, and employee morale, productivity and retention could suffer, which may have an adverse effect on our business, financial condition and operating results.
Increases in labor costs, including wages, could adversely affect our business, financial condition and results of operations.
Labor is a significant portion of our cost structure and is subject to many external factors, including unemployment levels, prevailing wage rates, minimum wage laws, potential collective bargaining arrangements, health insurance costs and other insurance costs and changes in employment and labor legislation or other workplace regulation. From time to time, legislative proposals are made to increase the federal minimum wage in the United States, as well as the minimum wage in California and a number of other states and municipalities, and to reform entitlement programs, such as health insurance and paid leave programs. As minimum wage rates increase or related laws and regulations change, we may need to increase not only the wage rates of our minimum wage employees, but also the wages paid to our other hourly or salaried employees. Any increase in the cost of our labor could have an adverse effect on our business, financial condition and results of operations or if we fail to pay such higher wages we could suffer increased employee turnover. Increases in labor costs could force us to increase prices, which could adversely impact our sales. If competitive pressures or other factors prevent us from offsetting increased labor costs by increases in prices, our profitability may decline and could have a material adverse effect on our business, financial condition and results of operations.
Fluctuations in wage rates and the price, availability and quality of raw materials and finished goods could increase costs.
Fluctuations in the price, availability and quality of fabrics, leather or other raw materials used by us in our manufactured products, or of purchased finished goods, could have a material adverse effect on our cost of goods sold or our ability to meet our customers’ demands. The prices we pay depend on demand and market prices for the raw materials used to produce them. The price and availability of such raw materials may fluctuate significantly, depending on many factors, including general economic conditions and demand, energy prices, weather patterns and public health issues, such as the current COVID-19 pandemic. Increased demand for raw materials with a limited supply, such as sustainably harvested cotton, could negatively impact our ability to meet our customers’ demands for certain products. Prices of purchased products also depend on wage rates in China and other geographic areas where our suppliers are located, as well as shipping and freight costs from those regions. Inflation can also have a long-term impact on us because increasing costs of materials and labor may impact our ability to maintain satisfactory margins. Similarly, a significant portion of our products are manufactured in China, and declines in the value of the U.S. dollar may result in higher reported procurement costs. In the future, we may not be able to offset cost increases with other cost reductions or efficiencies or to pass higher costs on to our customers. This could have a material adverse effect on our results of operations, liquidity and financial condition.
Our third-party suppliers and manufacturers are based primarily in China, which exposes us to risks inherent in doing business there.
We use third-party suppliers and manufacturers based primarily in China. We use only a limited number of suppliers. This sourcing concentration increases our dependence of these suppliers and exposes us to the risks of doing business in China. We may have greater risks than our peers due to the concentration of our suppliers and manufacturers in China. With the rapid development of the Chinese economy, the cost of labor has increased and may continue to increase in the future. Our results of operations will be materially and adversely affected if the labor costs of our third-party suppliers increase significantly. In addition, our suppliers may not be able to find a sufficient number of qualified workers due to the intensely competitive and fluid market for skilled labor in China.
Sourcing products from China exposes us to political, legal and economic risks. In particular, the political, legal and economic climate in China, both nationally and regionally, is fluid and unpredictable. Our ability to operate in China may be adversely affected by changes in U.S., Australian and Chinese laws and regulations such as those related to, among other things, taxation, import and export tariffs, custom duties, environmental regulations, land use rights, intellectual property, currency controls, network security, sanctions, embargoes, employee benefits and other matters. In addition, we may not obtain or retain the requisite legal permits to continue to operate in China, and costs or operational limitations may be imposed in connection with obtaining and complying with such permits. In addition, Chinese trade regulations are in a state of flux, and we may become subject to other forms of taxation, tariffs and duties in these jurisdictions. Furthermore, the third parties we rely on in China may disclose our confidential information or intellectual property to competitors or third parties, which could result in the illegal distribution and sale of counterfeit versions of our products. If any of these events occur, our business, financial condition and results of operations could be materially and adversely affected.
We purchase inventory in anticipation of sales, and if we are unable to manage our inventory effectively, our operating results could be adversely affected.
Our business requires us to manage a large volume of inventory, including precise quantities across a large number of different products, effectively. We add new apparel, footwear and accessories styles to our sites every week, and we depend on our forecasts of demand to make purchasing decisions and manage our inventory of stock-keeping units, or SKUs. Demand for products, however, can change significantly between the time inventory is ordered and the date of sale. Demand may be affected by, among other things, the COVID-19 pandemic, new trends, seasonality, new product launches, rapid changes in product cycles and pricing, product defects, promotions, changes in consumer spending patterns, changes in consumer tastes with respect to our products and other factors, including political instability and social unrest. Our customers may not purchase products in the quantities that we expect.
It may be difficult to accurately forecast demand and determine appropriate levels of product. We generally do not have the right to return unsold products to our suppliers. If we fail to manage our inventory effectively or negotiate favorable credit terms with third-party suppliers, we may be subject to a heightened risk of inventory obsolescence, a decline in inventory values and significant inventory write-downs or write-offs. In addition, if we are required to lower sale prices in order to reduce inventory levels or to pay higher prices to our suppliers, our profit margins may be negatively affected. Any failure to manage brand expansion or accurately forecast demand for brands could adversely affect our growth and our margins.
Privacy concerns and regulatory restrictions regarding the collection, use and processing of data could limit our ability to identify and respond to trends and to manage inventory. In addition, our ability to meet customer demand may be negatively impacted by a shortage in inventory due to reduced inventory purchases or disruptions in the supply chain due to a number of factors, including the COVID-19 pandemic. Historically, a substantial portion of the products we source from third parties have been manufactured in China. The COVID-19 pandemic has impacted, and will continue to impact, our supply chain as manufacturers operate at reduced capacity and demand from the online retail channel outpaces capacity. We also experienced increased shipping costs and transport delays as a result of the COVID-19 pandemic and weather-related conditions. While we seek to further diversify our supply chain and sourcing, we may not be able to diversify in a cost effective manner, or at all, which may materially and adversely affect our business, financial condition and operating results. Our distribution centers have been running at reduced capacity as a result of social distancing and other mandates in response to the COVID-19 pandemic. All of these challenges in our supply chain have affected, and may in the future affect, the quality of our products, the volume of refunds and returns, our brand reputation and our customers’ satisfaction and loyalty.
If we experience problems with our distribution and warehouse management systems, our ability to meet customer expectations, manage inventory, complete sales transactions and achieve objectives for operating efficiencies could be adversely affected.
In the U.S., we rely on fulfillment centers in California, New Jersey and Missouri, which are operated by our third-party logistics provider, for all of our product distribution. Our fulfillment centers include computer-controlled and automated equipment and rely on a warehouse management system to manage supply chain fulfillment operations, which means their operations are complicated and may be subject to a number of risks related to cybersecurity, the proper operation of software and hardware, electronic or power interruptions or other system failures. In addition, because most of our U.S. fulfilled products are distributed from three primary fulfillment centers, our operations could also be interrupted by labor difficulties, or by floods (such as the recent flood in northeastern Australia), fires or other natural disasters near our fulfillment centers. We maintain business interruption insurance, but it may not adequately protect us from the adverse effects that could result from significant disruptions to our distribution system, such as the long-term loss of customers or an erosion of our brand image. Moreover, if we or our third-party logistics provider are unable to adequately staff our fulfillment centers to meet demand or if the cost of such staffing is higher than historical or projected costs due to mandated wage increases, regulatory changes, hazard pay, international expansion or other factors, our results of operations could be harmed. In addition, operating fulfillment centers comes with potential risks, such as workplace safety issues and employment claims for the failure or alleged failure to comply with labor laws or laws respecting union organizing activities. Our distribution capacity is also dependent on the timely performance of services by third parties, including the shipping of our products to and from our California, New Jersey and Missouri distribution facilities. We may need to operate additional fulfillment centers in the future to keep pace with the growth of our business, and we cannot assure you that we will be able to locate suitable facilities on commercially acceptable terms in accordance with our expansion plans, nor can we assure you that we will be able to recruit qualified managerial and operational personnel to support our expansion plans. If we encounter problems with our distribution and warehouse management systems, our ability to meet customer expectations, manage inventory and fulfillment capacity, complete sales transactions, fulfill orders in a timely manner and achieve objectives for operating efficiencies could be adversely affected, which could also harm our reputation and our relationship with our customers.
If we do not successfully optimize, operate and manage the expansion of the capacity of our fulfillment centers, our business, financial condition and results of operations could be harmed.
We anticipate the need to add fulfillment center capacity as our business continues to grow. If we continue to add fulfillment and warehouse capabilities, add products categories with different fulfillment requirements or change the mix in products that we sell, our fulfillment network will become increasingly complex and operating it will become more challenging. The expansion of our fulfillment center capacity may put pressure on our managerial, financial, operational and other resources. We cannot assure you that we will be able to locate suitable facilities on commercially acceptable terms in accordance with our expansion plans, nor can we assure you that we will be able to recruit qualified managerial and operational personnel to support our expansion plans. In addition, we may be required to expand our capacity sooner than we anticipate. If we are unable to secure new facilities for the expansion of our fulfillment operations, recruit qualified personnel to support any such facilities or effectively control expansion-related expenses, our order fulfillment and shipping times may be delayed and our business, financial condition and results of operations could be adversely affected.
Risks Relating to the Culture Kings Acquisition
We may not realize all of the anticipated benefits of the Culture Kings acquisition within the expected timeframe or at all.
The Culture Kings acquisition is the largest acquisition in our history, as measured by purchase price. The full benefits of the acquisition, including the anticipated sales or growth opportunities, may not be realized within the anticipated time frame, or at all. The risks that may impact our successful integration of Culture Kings into our business and platform include:
•loss of Culture Kings’ brand identity as a result of becoming part of a larger company;
•difficulties integrating operations and systems, for example, with respect to accounting and IT systems;
•difficulties integrating company policies and cultures;
•the failure to retain and assimilate Culture Kings’ employees; and
•our lack of experience operating brick-and-mortar stores.
Uncertainty about realizing the full benefits of the Culture Kings acquisition may expose us to financial and operational risks. These uncertainties may impair our ability to attract, retain and motivate key personnel and could cause our customers, suppliers and other business partners to delay or defer certain business decisions or to seek to change existing business relationships with us. The integration process will result in significant costs and may divert management attention and resources. We may also fail to realize the anticipated financial benefits from the Culture Kings acquisition. The occurrence of any of these events could have a material adverse effect on our operating results.
The acquisition of Culture Kings exposes us to additional business risks that could adversely affect our business.
The success of the Culture Kings acquisition will depend on our ability to successfully integrate Culture Kings into our platform and operations, and to market Culture Kings in the U.S., which may require significant investment. In addition, the Culture Kings business introduces new risks to our platform. These risks include:
•the Culture Kings brand may not resonate with customers in the U.S.;
•Culture Kings may experience greater pricing competition in the U.S.;
•Culture Kings’ sale of third-party brands exposes our platform to licensing risks;
•Culture Kings’ joint venture agreements may expose us to risks related to jointly-owned intellectual property;
•we may encounter difficulties opening brick-and-mortar stores and expanding our supply chain and distribution network for Culture Kings;
•Culture Kings’ brick-and-mortar stores will expose us to premises liabilities, such as slip and falls, and may subject us to greater potential labor union activity; and
•Culture Kings may be vulnerable to greater reputational risk from association with celebrity endorsements.
Failure to effectively manage these new risks and achieve the anticipated benefits of the acquisition could adversely affect our operations and our future growth prospects.
Risks Relating to Laws and Regulation
Changes in laws or regulations relating to data privacy and security, or any actual or perceived failure by us to comply with such laws and regulations, or contractual or other obligations relating to data privacy and security, could lead to government enforcement actions (which could include civil or criminal penalties), private litigation or adverse publicity and could have a material adverse effect on our reputation, results of operations, financial condition and cash flows.
We are, and may increasingly become, subject to various laws, directives, industry standards and regulations, as well as contractual obligations, relating to data privacy and security in the jurisdictions in which we operate. The regulatory environment related to data privacy and security is increasingly rigorous, with new and constantly changing requirements applicable to our business, and enforcement practices are likely to remain uncertain for the foreseeable future. These laws and regulations may be interpreted and applied differently over time and from jurisdiction to jurisdiction, and it is possible that they will be interpreted and applied in ways that may have a material adverse effect on our results of operations, financial condition and cash flows.
In the U.S., various federal and state regulators, including governmental agencies like the Consumer Financial Protection Bureau and the Federal Trade Commission (“FTC”), have adopted, or are considering adopting, laws and regulations concerning personal information and data security and have prioritized privacy and information security violations for enforcement actions. Certain state laws may be more stringent or broader in scope, or offer greater individual rights, with respect to personal information than federal, international or other state laws, and such laws may differ from each other, all of which may complicate compliance efforts. For example, the CCPA, which increases privacy rights for California residents and imposes obligations on companies that process their personal information, went into effect on January 1, 2020. Among other things, the CCPA requires covered companies to provide new disclosures to California consumers and provide such consumers new data protection and privacy rights, including the ability to opt-out of certain data sharing arrangements of personal information, and the ability to access and delete personal information. The CCPA provides for civil penalties for violations, as well as a private right of action for certain data breaches that result in the loss of personal information. This private right of action may increase the likelihood of, and risks associated with, data breach litigation.
Furthermore, in November 2020, California voters passed the California Privacy Rights Act of 2020 (“CPRA”). Effective beginning January 1, 2023, the CPRA imposes additional obligations on companies covered by the legislation and will significantly modify the CCPA, including by expanding California residents’ rights with respect to certain sensitive personal information. The CPRA also creates a new state agency that will be vested with authority to implement and enforce the CCPA and CPRA. Other jurisdictions in the U.S. have also adopted or are proposing privacy and data security laws that are similar or more restrictive than the CCPA, CPRA and GDPR (described below). including the Virginia Consumer Protection Act (“Virginia CDPA”) and the Colorado Privacy Act (Colorado Act”), each of which will become effective in 2023, further complicating the legal landscape. In addition, laws in all 50 U.S. states require businesses to provide notice to consumers whose personal information has been accessed or acquired as a result of a data breach, and, in some cases, provide notice to regulators. State laws are changing rapidly and there is discussion in Congress of a new comprehensive federal data privacy law to which we would become subject if it is enacted, which may add additional complexity, variation in requirements, restrictions and potential legal risks, require additional investment of resources in compliance programs, impact strategies and the availability of previously useful data and could result in increased compliance costs or changes in business practices and policies.
We are also subject to international laws, regulations and standards in many jurisdictions, which apply broadly to the collection, use, retention, security, disclosure, transfer and other processing of personal information. For example, the GDPR, which became effective in May 2018, greatly increased the European Commission’s jurisdictional reach of its laws and adds a broad array of requirements for handling personal data. EU member states are tasked under the GDPR to enact, and have enacted, certain implementing legislation that adds to and/or further interprets the GDPR requirements and potentially extends our obligations and potential liability for failing to meet such obligations. The GDPR, together with national legislation, regulations and guidelines of the EU member states and the United Kingdom governing the processing of personal data, impose strict obligations and restrictions on the ability to collect, use, retain, protect, disclose, transfer and otherwise process personal data. In particular, the GDPR includes obligations and restrictions concerning data transparency and consent, the overall rights of individuals to whom the personal data relates, the transfer of personal data out of the European Economic Area (“EEA”) or the United Kingdom, security breach notifications and the security and confidentiality of personal data. The GDPR authorizes fines for certain violations of up to 4% of global annual revenue or €20 million, whichever is greater. Recent legal developments in Europe have created further complexity and uncertainty regarding transfers of personal data from the EEA and the United Kingdom to the United States. Most recently, in July 2020, the Court of Justice of the European Union (“CJEU”) invalidated the EU-U.S. Privacy Shield Framework (“Privacy Shield”) under which personal data could be transferred from the EEA to the United States. While the CJEU upheld the adequacy of standard contractual clauses, a standard form of contract approved by the European Commission as an adequate personal data transfer mechanism and potential alternative to the Privacy Shield, it made clear that reliance on them alone may not necessarily be sufficient in all circumstances.
Further, the United Kingdom’s decision to leave the EU has created uncertainty with regard to data protection regulation in the United Kingdom. As of January 1, 2021, we are also subject to the UK GDPR and UK Data Protection Act of 2018, which retains the GDPR in the United Kingdom’s national law. These recent developments will require us to review and amend the legal mechanisms by which we make and receive personal data transfers. As supervisory authorities issue further guidance on personal data export mechanisms, including circumstances where the standard contractual clauses and other mechanisms cannot be used, or start taking enforcement action, we could suffer additional costs, complaints or regulatory investigations or fines, or if we are otherwise unable to transfer personal data between and among countries and regions in which we operate, it could affect the manner in which we do business, the geographical location or segregation of our relevant operations, and could adversely affect our financial results.
Although we are working to bring our data privacy and cybersecurity practices into compliance with the GDPR, CCPA and other privacy laws which apply to our business, we may not currently comply fully with all aspects of such laws. To the extent we are currently not in compliance with such laws, we may face increased legal, financial and regulatory risks. All of these evolving compliance and operational requirements impose significant costs, such as costs related to organizational changes, implementing additional protection technologies, training associates and engaging consultants, which are likely to increase over time. The burdens imposed by privacy and data security laws and regulations may also limit our ability to analyze customer data, reduce the efficiency of our marketing, lead to negative publicity or make it more difficult to meet expectations of or commitments to clients, any of which could harm our business. In addition, these laws could impact our ability to offer our products in certain locations. These costs, burdens, and potential liabilities could be compounded if other jurisdictions in the U.S. or abroad begin to adopt similar or more restrictive privacy and data security laws. Such restrictions may require us to modify our data processing practices and policies, distract management or divert resources from other initiatives and projects, all of which could have a material adverse effect on our results of operations, financial condition and cash flows.
Any failure or perceived failure by us to comply with any applicable federal, state or foreign laws and regulations relating to data privacy and security, or even the perception that the privacy of personal information is not satisfactorily protected, could result in damage to our reputation and our relationship with our customers, as well as proceedings or litigation by governmental agencies or customers, including class action privacy litigation in certain jurisdictions, which could subject us to significant fines, sanctions, awards, penalties or judgments, any of which could result in costly investigations and litigation, civil or criminal penalties, operational changes and negative publicity that could adversely affect our reputation, as well as our results of operations and financial condition.
Changes in accounting standards and subjective assumptions, estimates and judgments by management related to complex accounting matters could significantly affect our financial results or financial condition.
Generally accepted accounting principles and related accounting pronouncements, implementation guidelines and interpretations with regard to a wide range of matters that are relevant to our business, including but not limited to revenue recognition, leases, impairment of goodwill and intangible assets, inventory, income taxes and litigation, are highly complex and involve many subjective assumptions, estimates and judgments. Changes in these rules or their interpretation or changes in underlying assumptions, estimates or judgments could significantly change or increase volatility of our reported or expected financial performance or financial condition. Refer to Note 2, “Significant Accounting Policies,” in the Notes to our Consolidated Financial Statements included in this Annual Report on Form 10-K for a description of recent accounting pronouncements.
Our suppliers may not comply with our legal and social compliance program requirements, which could adversely affect our reputation.
We have a supplier compliance program that is monitored on a regular basis by our buying offices. Our suppliers’ facilities are either certified as in compliance with our program, or areas of improvement are identified and corrective follow-up action is taken. All suppliers are required to follow applicable national labor laws, as well as international compliance standards regarding workplace safety, such as standards that require clean and safe working environments, clearly marked exits and paid overtime. We also require those vendors to follow sourcing guidelines, which include environmental, labor, health, and safety standards. We believe in protecting the safety and working rights of the people who manufacture the products we sell, while recognizing and respecting cultural and legal differences found throughout the world. We require our third-party suppliers to register through an online website and agree that they and their vendors will abide by certain standards and conditions of employment. If our third-party suppliers fail to comply with our social compliance program, our reputation may be adversely affected. From time to time, contractors or their subcontractors may not be in compliance with these standards or applicable local laws. Significant or continuing noncompliance with such standards and laws by one or more suppliers could have a negative impact on our reputation, subject us to liability and have an adverse effect on our results of operations.
Our business is subject to federal, state, local and international laws and regulations regarding consumer protection, promotions, safety and other matters. The costs of compliance with, or the violation of, such laws and regulations by us or by independent suppliers who manufacture products for us could have an adverse effect on our operations and cash flows, as well as on our reputation.
Our business is subject to federal, state, local and international laws and regulations on a wide range of consumer protection, promotion and pricing of merchandise, safety and other matters. The merchandise we sell to our customers is subject to regulation by the Federal Consumer Product Safety Commission, the FTC and similar state and international regulatory authorities. For example, the FTC labeling regulations require us to accurately disclose, on our website and on every item of apparel, the country of origin for each item and the materials used in its manufacture. We are subject to risks related to the interpretation of state and local laws and regulations governing the collection and remittance of sales and use taxes, and laws and regulations governing pricing, promotions and sales. We could be adversely affected by costs of compliance with or violations of those laws and regulations. In addition, we require third-party suppliers to operate in compliance with applicable laws, rules and regulations regarding working conditions, safety, employment practices and environmental compliance, which could increase our costs due to the costs of compliance by those contractors. Failure by us or our third-party suppliers to comply with such laws and regulations, as well as with ethical, social, product, labor and environmental standards, or related political considerations, could result in interruption of finished goods shipments to us, cancellation of orders by customers and termination of relationships. If one of our independent contractors violates labor or other laws, implements labor or other business practices or takes other actions that are generally regarded as unethical, it could jeopardize our reputation and potentially lead to various adverse consumer actions, including boycotts that may reduce demand for our merchandise. Damage to our reputation or loss of consumer confidence for any of these or other reasons could have a material adverse effect on our results of operations, financial condition and cash flows, as well as require additional resources to rebuild our reputation.
Unfavorable changes or failure by us to comply with evolving internet and eCommerce regulations could substantially harm our business and operating results.
We are subject to general business regulations and laws as well as regulations and laws specifically governing the internet and eCommerce. These regulations and laws may involve taxes, privacy and data security, consumer protection, the ability to collect and/or share necessary information that allows us to conduct business on the internet, marketing communications and advertising, content protection, electronic contracts and gift cards. Furthermore, the regulatory landscape impacting internet and eCommerce businesses is constantly evolving. For example, California’s Automatic Renewal Law requires companies to adhere to enhanced disclosure requirements when entering into automatically renewing contracts with consumers. As a result, a wave of consumer class action lawsuits was brought against companies that offer online products and services on a subscription or recurring basis. Any failure, or perceived failure, by us to comply with any of these laws or regulations could result in damage to our reputation, lost business, and proceedings or actions against us by governmental entities or others, which could impact our operating results.
Developments in labor and employment law and any unionizing efforts by employees could have a material adverse effect on our results of operations.
We face the risk that Congress, federal agencies or one or more states could approve legislation or regulations significantly affecting our businesses and our relationship with our employees and other individuals providing valuable services to us, such as our influencers and models. For example, the previously proposed federal legislation referred to as the Employee Free Choice Act would have substantially liberalized the procedures for union organization. None of our domestic employees are currently covered by a collective bargaining agreement, but any attempt by our employees to organize a labor union could result in increased legal and other associated costs. Additionally, given the National Labor Relations Board’s “speedy election” rule, our ability to timely and effectively address any unionizing efforts would be difficult. If we enter into a collective bargaining agreement with our domestic employees, the terms could materially adversely affect our costs, efficiency and ability to generate acceptable returns on the affected operations.
Federal and state wage and hour rules establish minimum salary requirements for employees to be exempt from overtime payments. For example, among other requirements, California law requires employers to pay employees who are classified as exempt from overtime a minimum salary of at least twice the minimum wage, which is currently $54,080 per year for executive, administrative and professional employees with employers that have 26 or more employees. Minimum salary requirements impact the way we classify certain employees, increases our payment of overtime wages and provision of meal or rest breaks, and increases the overall salaries we are required to pay to currently exempt employees to maintain their exempt status. As such, these requirements may have a material adverse effect on our business, financial condition and results of operations.
Further, the laws and regulations that govern the status and classification of independent contractors and other similar non-employee services providers are subject to change and divergent interpretations by various authorities, which can create uncertainty and unpredictability for us. For example, a new law in California, known as Assembly Bill 5, which took effect in January 2020, codifies and extends an employment classification test set forth by the California Supreme Court that established a new standard for determining employee or independent contractor status. The passage of this bill, and other similar initiatives throughout the United States, could lead to additional challenges to the classification of influencers and models, and a potential increase in claims, lawsuits, arbitration proceedings, administrative actions, government investigations and other legal and regulatory proceedings at the federal, state and municipal levels challenging the classification of any influencers or models as independent contractors. Such regulatory scrutiny or actions over such classification practices also may create different or conflicting obligations from one jurisdiction to another. Although we are currently not involved in any material legal actions and, to our knowledge, there have been no materials claims of misclassification made against us, the likelihood of misclassification claims in states like California has increased in light of laws such as Assembly Bill 5, and the results of any such litigation or arbitration are inherently unpredictable and legal proceedings related to such claims, individually or in the aggregate, could have a material impact on the Company’s business, financial condition and results of operations. Regardless of the outcome, litigation and arbitration of misclassification and wage and hour claims can have an adverse impact on us because of defense and settlement costs individually and in the aggregate, diversion of management resources and other factors, which could have a material adverse effect on our business, financial condition and results of operations.
Climate change and increased focus by governmental and non-governmental organizations, customers, consumers and investors on sustainability issues, including those related to climate change, may adversely affect our business and financial results and damage our reputation.
Our business and results of operations could be adversely affected by climate change and the adoption of new climate change laws, policies and regulations. Growing concerns about climate change and greenhouse gas emissions have led to the adoption of various regulations and policies, including the Paris Agreement negotiated at the 2015 United Nations Conference on Climate Change, which requires participating nations to reduce carbon emissions every five years beginning in 2023. Climate change may impact our business in numerous ways. For example, governments may impose new taxes to finance efforts to reduce the impact of climate change, any of which may increase shipping and freight costs and prices for our products. We also face the risk that governmental or non-governmental organizations may increase their focus on the fashion sector and implement greater environmental regulation on the fashion sector in the United States or the fashion sector in other markets. For example, the fashion industry’s process for dying fabrics uses large quantities of water, and the disposition of the waste water directly impacts the environment. Increased scrutiny and regulation of this practice may adversely affect our business.
Additionally, some scientists have concluded that increasing concentrations of greenhouse gases in the earth’s atmosphere may produce climate changes that have significant physical effects, such as increased frequency and severity of storms, droughts, floods and other climatic events. Increased frequency of extreme weather could cause increased incidence of disruption to the production and distribution of our products and an adverse impact on consumer demand and spending. If any such climate changes were to occur, they could have an adverse effect on our financial condition and results of operations.
Changes to U.S., Australian or international trade policy, tariff and import/export regulations or our failure to comply with such regulations may have a material adverse effect on our reputation, business, financial condition and results of operations.
Changes in U.S., Australian or international social, political, regulatory and economic conditions or in laws and policies governing foreign trade, manufacturing, development and investment in the territories or countries where we currently sell our products or conduct our business, as well as any negative sentiment toward the U.S. or Australia as a result of such changes, could adversely affect our business. The U.S. and Australian governments have from time to time instituted or proposed changes in trade policies that include the negotiation or termination of trade agreements, the imposition of higher tariffs on imports into the U.S. and Australia, economic sanctions on individuals, corporations or countries, and other government regulations affecting trade between the U.S., Australia and other countries where we conduct our business. It may be time-consuming and expensive for us to alter our business operations in order to adapt to or comply with any such changes.
As a result of recent policy changes of the U.S. and Australian governments and recent U.S. and Australian government proposals, there may be greater restrictions and economic disincentives on international trade. The new tariffs and other changes in U.S. and Australian trade policy have in the past and could continue to trigger retaliatory actions by affected countries, and certain foreign governments have instituted or are considering imposing retaliatory measures on certain U.S. and Australian goods. We, similar to many other multinational corporations, do a significant amount of business that would be impacted by changes to the trade policies of the U.S., Australia, and foreign countries (including governmental action related to tariffs, international trade agreements, or economic sanctions). Such changes have the potential to adversely impact the U.S. and Australian economy or certain sectors thereof, our industry and the global demand for our products, and as a result, could have a material adverse effect on our business, financial condition and results of operations.
Our reliance on overseas manufacturing and supply partners, including vendors located in jurisdictions presenting an increased risk of bribery and corruption, exposes us to legal, reputational and supply chain risk through the potential for violations of federal and international anti-corruption law.
We derive a significant portion of our merchandise for our owned brands from third-party manufacturing and supply partners in foreign countries and territories, including countries and territories perceived to carry an increased risk of corrupt business practices. The U.S. Foreign Corrupt Practices Act (“FCPA”) prohibits U.S. corporations and their representatives from offering, promising, authorizing or making payments to any foreign government official, government staff member, political party or political candidate in an attempt to obtain or retain business abroad. Likewise, the SEC, the U.S. Department of Justice, OFAC, the U.S. Department of State, as well as other foreign regulatory authorities continue to enforce economic and trade regulations and anti- corruption laws, across industries. U.S. trade sanctions relate to transactions with designated foreign countries and territories as well as specially targeted individuals and entities that are identified on U.S. and other government blacklists, and those owned by them or those acting on their behalf. Notwithstanding our efforts to conduct our operations in material compliance with these regulations, our international vendors could be determined to be our “representatives” under the FCPA, which could expose us to potential liability for the actions of these vendors under the FCPA. If we or our vendors were determined to have violated OFAC regulations, the FCPA, the U.K. Bribery Act of 2010 or any of the anti-corruption and anti-bribery laws in the countries and territories where we and our vendors do business, we could suffer severe fines and penalties, profit disgorgement, injunctions on future conduct, securities litigation, bans on transacting certain business and other consequences that may have a material adverse effect on our business, financial condition and results of operations. In addition, the costs we may incur in defending against any anti-corruption investigations stemming from our or our vendors’ actions could be significant. Moreover, any actual or alleged corruption in our supply chain could carry significant reputational harms, including negative publicity, loss of goodwill and decline in share price.
We depend upon third-party suppliers and manufacturers, making us vulnerable to supply disruptions and price fluctuations.
We rely on a number of third-party suppliers and manufacturers to provide our products, including one supplier that represents approximately 13% of our purchase orders. Our suppliers may encounter problems for a variety of reasons, including unanticipated demand from larger customers, equipment malfunction, environmental factors and public health emergencies including but not limited to the global COVID-19 pandemic, any of which could delay or impede their ability to meet our demand.
Our reliance on these third-party suppliers also subjects us to other risks that could harm our business, including:
•interruption of supply resulting from modifications to, or discontinuation of, a supplier’s operations;
•delays in product shipments resulting from errors in manufacturing, defects or reliability issues from suppliers;
•inability to obtain adequate supplies in a timely manner or on commercially reasonable terms;
•difficulty locating and qualifying alternative suppliers, especially with respect to our 12% supplier;
•the failure of our suppliers to comply with regulatory requirements, which could result in disruption of supply or increased expenses; and
•inability of suppliers to fulfill orders and meet requirements due to financial hardships.
If we are unable to arrange for third-party supply or manufacturing of our products, or to do so on commercially reasonable terms, we may not be able to complete development of, market and sell our current or new products. Failure to meet customer orders could result in loss of customers or harm our ability to attract new customers, either of which could have a material and adverse effect on our business, financial condition, results of operations and growth.
Risks Relating to Our Intellectual Property Rights and Our Technology
We rely significantly on information technology. Any inadequacy, interruption, integration failure or security failure of this technology could harm our ability to effectively operate our business.
Our ability to effectively manage and operate our business depends significantly on information technology systems. We rely heavily on information technology to enable, track and facilitate sales and inventory and manage our supply chain. We are also dependent on information technology, including the internet, for our direct-to-consumer sales, including our eCommerce operations and retail business credit card transaction authorization. Despite our preventative efforts, our systems and those of our third-party service providers may be vulnerable to damage, failure or interruption due to viruses, data security incidents, technical malfunctions, natural disasters or other causes, or in connection with upgrades to our system or the implementation of new systems. The failure of these systems to operate effectively, problems with transitioning to upgraded or replacement systems, difficulty in integrating new systems or systems of acquired businesses or a breach in security of these systems could adversely impact the operations of our business, including our reputation, management of inventory, ordering and replenishment of products, manufacturing and distribution of products, eCommerce operations, retail business credit card transaction authorization and processing, corporate email communications and our interaction with the public on social media.
A security breach or other disruption to our information technology systems could result in the loss, theft, misuse, unauthorized disclosure or unauthorized access of customer, supplier, or sensitive company information or could disrupt our operations, which could damage our relationships with customers, suppliers or employees, expose us to litigation or regulatory proceedings or harm our reputation, any of which could materially adversely affect our business, financial condition or results of operations.
Our business involves the storage and transmission of a significant amount of personal, confidential, or sensitive information, including the personal information of our customers, credit card information, the personal information of our employees, information relating to customer preferences and our proprietary financial, operational and strategic information. The protection of this information is vitally important to us as the loss, theft, misuse, unauthorized disclosure or unauthorized access of such information could lead to significant reputational or competitive harm, result in litigation involving us or our business partners, expose us to regulatory proceedings and cause us to incur substantial liabilities, fines, penalties or expenses. As a result, we believe our future success and growth depends, in part, on the ability of our key business processes and systems, including our information technology and global communication systems, to prevent the theft, loss, misuse, unauthorized disclosure or unauthorized access of this personal, confidential and sensitive information, and to respond quickly and effectively if data security incidents do occur. As with many businesses, we are subject to numerous data privacy and security risks, which may prevent us from maintaining the privacy of this information, result in the disruption of our business and require us to expend significant resources attempting to secure and protect such information and respond to incidents, any of which could materially adversely affect our business, financial condition or results of operations.
The frequency, intensity, and sophistication of cyber-attacks, ransom-ware attacks and other data security incidents has significantly increased in recent years. As with many other businesses, we have experienced, and are continually at risk of being subject to, attacks and incidents. Due to the increased risk of these types of attacks and incidents, we expend significant resources on information technology and data security tools, measures and processes designed to protect our information technology systems, as well as the personal, confidential or sensitive information stored on or transmitted through those systems, and to ensure an effective response to any cyber-attack or data security incident. Whether or not these measures are ultimately successful, these expenditures could have an adverse impact on our financial condition and results of operations and divert management’s attention from pursuing our strategic objectives.
In addition, although we take the security of our information technology systems seriously, there can be no assurance that the security measures we employ will effectively prevent unauthorized persons from obtaining access to our systems and information. Despite the implementation of reasonable security measures by us and our third-party providers, our systems and information are susceptible to physical or electronic break-ins, security breaches from inadvertent or intentional actions of our employees, third-party service providers, contractors, consultants, business partners or other third parties, from cyber-attacks by malicious third parties (including the deployment of harmful malware, ransomware, denial-of service attacks, social engineering and other means to affect service reliability and threaten the confidentiality, integrity and availability of information) or other data security incidents. These risks may be exacerbated in the remote work environment. In addition, because the techniques used to obtain unauthorized access to information technology systems are constantly evolving and becoming more sophisticated, they may not be recognized until launched, and can originate from a wide variety of sources, including outside groups such as external service providers, organized crime affiliates, terrorist organizations or hostile foreign governments or agencies, we may be unable to anticipate these techniques or implement adequate preventive measures in response.
Cyber-attacks or data security incidents could remain undetected for an extended period, which could potentially result in significant harm to our systems, as well as unauthorized access to the information stored on and transmitted by our systems. Even when a security breach is detected, the full extent of the breach may not be determined immediately. The costs to us to mitigate network security problems, bugs, viruses, worms, malicious software programs and security vulnerabilities could be significant and, while we have implemented security measures to protect our systems, our efforts to address these problems may not be successful. Further, despite our security efforts and training, our employees may purposefully or inadvertently cause security breaches that could harm our systems or result in the unauthorized disclosure of or access to information. Any measures we do take to prevent security breaches, whether caused by employees or third parties, have the potential to limit our ability to complete sales or ship products to our customers, harm relationships with our suppliers or restrict our ability to meet our customers’ expectations with respect to their online or retail shopping experience.
A cyber-attack or other data security incident could result in the significant and protracted disruption of our business such that:
•critical business systems become inoperable or require a significant amount of time or cost to restore;
•key personnel are unable to perform their duties, communicate with employees, customers or third- party partners;
•it results in the loss, theft, misuse, unauthorized disclosure, or unauthorized access of customer, supplier or company information;
•we are prevented from accessing information necessary to conduct our business;
•we are required to make unanticipated investments in equipment, technology or security measures;
•customers cannot access our eCommerce websites, and customer orders may not be received or fulfilled;
•we become subject to return fraud schemes, reselling schemes and imposter sites schemes; or
•we become subject to other unanticipated liabilities, costs or claims.
If any of these events were to occur, it could have a material adverse effect on our financial condition and results of operations and result in harm to our reputation.
In addition, if a cyber-attack or other data incident results in the loss, theft, misuse, unauthorized disclosure or unauthorized access of personal, confidential or sensitive information belonging to our customers, suppliers, or employees, it could put us at a competitive disadvantage, result in the deterioration of our customers’ confidence in our brands, cause our suppliers to reconsider their relationship with our company or impose more onerous contractual provisions and subject us to potential litigation, liability, fines and penalties. While we maintain insurance coverage that may, subject to policy terms and conditions, cover certain aspects of the losses and costs associated with cyber-attacks and data incidents, such insurance coverage may be insufficient to cover all losses and would not, in any event, remedy damage to our reputation. In addition, we may face difficulties in recovering any losses from our provider and any losses we recover may be lower than we initially expect.
We are also reliant on the security practices of our third-party service providers, which may be outside of our direct control. The services provided by these third parties are subject to the same risk of outages, other failures and security breaches described above. If these third parties fail to adhere to adequate security practices, or experience a breach of their systems, the data of our employees, customers and business associates may be improperly accessed, used or disclosed. In addition, our providers have broad discretion to change and interpret the terms of service and other policies with respect to us, and those actions may be unfavorable to our business operations. Our providers may also take actions beyond our control that could harm our business, including discontinuing or limiting our access to one or more services, increasing pricing terms, terminating or seeking to terminate our contractual relationship altogether, or altering how we are able to process data in a way that is unfavorable or costly to us. Although we expect that we could obtain similar services from other third parties, if our arrangements with our current providers were terminated, we could experience interruptions in our business, as well as delays and additional expenses in arranging for alternative cloud infrastructure services. Any loss or interruption to our systems or the services provided by third parties would adversely affect our business, financial condition and results of operations.
Customer growth and activity on mobile devices depends upon effective use of mobile operating systems, networks and standards that we do not control.
Purchases using mobile devices by consumers generally, and by our customers specifically, have increased significantly in recent years, and we expect this trend to continue. To optimize the mobile shopping experience, we are dependent on our customers downloading our specific mobile applications for their particular device or accessing our sites from an internet browser on their mobile device. As new mobile devices and platforms are released, it is difficult to predict the problems we may encounter in developing applications for these alternative devices and platforms, and we may need to devote significant resources to the creation, support and maintenance of such applications. In addition, our future growth and our results of operations could suffer if we experience difficulties in the future in integrating our mobile applications into mobile devices, if problems arise with our relationships with providers of mobile operating systems or mobile application download stores, such as those of Apple or Google, if our applications receive unfavorable treatment compared to competing applications, such as the order of our products in the Apple App Store, or if we face increased costs to distribute or have customers use our mobile applications. We are further dependent on the interoperability of our sites with popular mobile operating systems that we do not control, such as iOS and Android, and any changes in such systems that degrade the functionality of our sites or give preferential treatment to competitive products could adversely affect the usage of our sites on mobile devices. In the event that it is more difficult for our customers to access and use our sites on their mobile devices, or if our customers choose not to access or to use our sites on their mobile devices or to use mobile products that do not offer access to our sites, our customer growth could be harmed and our business, financial condition and operating results may be materially and adversely affected.
If the use of “cookie” tracking technologies is further restricted, regulated or blocked, or if changes in technology cause cookies to become less reliable or acceptable as a means of tracking consumer behavior, the amount or accuracy of internet user information we collect would decrease, which could harm our business and operating results.
Cookies are small data files that are sent by websites and stored locally on an internet user’s computer or mobile device. We, and third parties who work on our behalf, collect data via cookies that are used to track the behavior of visitors to our sites, provide a more personal and interactive experience and increase the effectiveness of our marketing. However, internet users can easily disable, delete and block cookies directly through browser settings or through other software, browser extensions or hardware platforms that physically block cookies from being created and stored.
Privacy regulations and policies by device operating systems, such as iOS or Android, restrict how we deploy our cookies and this could potentially increase the number of internet users that choose to proactively disable cookies on their systems. In the EU, the Directive on Privacy and Electronic Communications requires users to give their consent before cookie data can be stored on their local computer or mobile device. Users can decide to opt out of nearly all cookie data creation, which could negatively impact our operating results. We may have to develop alternative systems to determine our consumers’ behavior, customize their online experience or efficiently market to them if consumers block cookies or regulations introduce additional barriers to collecting cookie data.
Third parties may claim that we are infringing, misappropriating or otherwise violating their intellectual property rights or those of others. Intellectual property-related litigation and proceedings are expensive and time consuming to defend, and, if resolved adversely, could materially adversely impact our business, financial condition and results of operations. Intellectual property-related claims could also cause us to lose access to third-party service providers that we rely upon in the conduct of our business.
Our commercial success depends on our avoiding infringement, misappropriation or other violations of the intellectual property rights of third parties. We have in the past been, are currently and may in the future be subject to claims that some of our products are infringing, misappropriating or otherwise violating the trademarks, copyrights, patents or other intellectual property rights of third parties, which could be costly to defend and require us to pay damages. Such claims may be made by competitors seeking to obtain a competitive advantage or by other parties, including non-practicing entities with no relevant product revenue, and, therefore, our own intellectual property rights may provide little or no deterrence to these rights holders in bringing intellectual property rights claims against us. Additionally, some of our competitors have substantially greater resources than we do and are able to sustain the costs of complex intellectual property litigation to a greater degree and for longer periods of time than we could. Moreover, bringing or defending any such claim, regardless of merit, and whether successful or unsuccessful, could be expensive and time-consuming and have a negative effect on our business, reputation, results of operations and financial condition. The outcome of any litigation is inherently uncertain, and there can be no assurances that favorable final outcomes will be obtained in all cases. Furthermore, an adverse outcome of a dispute may result in an injunction requiring us to cease the commercialization of our products and could require us to pay substantial monetary damages, including treble damages and attorneys’ fees, if we are found to have willfully infringed a party’s intellectual property rights.
Our liability insurance may not cover potential claims of this type adequately or at all. Further, we may be unable to successfully resolve these type of conflicts to our satisfaction and may be required to enter into costly license agreements, if available, pay significant royalty, settlements costs or damages or rebrand our products or be prevented from selling some of our products. The terms of such a settlement or judgment may require us to cease some or all of our operations or pay substantial amounts to the other party. Even if we have an agreement to indemnify us against such costs, the indemnifying party may be unable or unwilling to uphold its contractual obligations. In addition, we may have to seek a license to continue practices found to be in violation of a third-party’s rights. If we are required, or choose to enter into royalty or licensing arrangements, such arrangements may not be available on reasonable terms, or at all, and may significantly increase our operating costs and expenses. Such arrangements may also only be available on a non-exclusive basis, such that third parties, including our competitors, could have access to use the same intellectual property to compete with us. We may also have to redesign our products so they do not infringe, misappropriate or otherwise violate third-party intellectual property rights, which may not be possible or may require substantial monetary expenditures and time, during which our products may not be available for commercialization or use. Such outcomes would increase our operating expenses, and if we cannot redesign our products in a non-infringing manner or obtain a license for any allegedly infringing aspect of our business, we may be forced to limit our product offerings, which could decrease our sales, reduce our operating margins and adversely affect our ability to compete effectively.
Additionally, such claims could result in third parties removing our allegedly infringed intellectual property, even if we are ultimately successful on the merit of the claims, in order to be shielded from legal liability under the Digital Millennium Copyright Act (“DMCA”). DMCA is intended, in part, to limit the liability of eligible service providers for caching, hosting or linking to, user content that include materials that infringe copyrights or other rights of others. Third parties that we rely upon in the operation of our business, including Shopify, our eCommerce and payments platform, rely on the protections provided by the DMCA in conducting their business. To protect their entitlement to the benefits of these protections, third parties, such as Shopify, have in the past threatened to deny us access to their services, and it is possible such third parties could deny us access to their services if we are alleged to infringe on the intellectual property rights of others, whether such claims are founded or unfounded, and the loss of such access could materially adversely affect our business. The loss of services of any third party that we rely on could adversely impact our ability to carry on business and could have a material adverse effect on our business, financial condition and results of operations. We could also be adversely impacted by future legislation and future judicial decisions altering the safe harbors of the DMCA or if international jurisdictions refuse to apply similar protections.
Failure to adequately establish, maintain, protect and enforce our intellectual property or proprietary rights, or prevent third parties from making unauthorized use of such rights, such as by counterfeiting of our products, could reduce sales and adversely affect the value of our brands.
Our intellectual property is an essential asset of our business. Our business could be significantly harmed if we are not able to establish, maintain, protect and enforce our intellectual property rights. We believe our competitive position is largely attributable to the value of our trademarks, trade dress, trade names, trade secrets, copyrights and other intellectual property rights. For example, we rely on trademark protection to protect our rights to various marks as well as distinctive logos and other marks associated with our products and services. If our trademarks and trade names are not adequately protected, we may not be able to build name recognition in our markets of interest and our business may be adversely affected. Effective trademark protection may not be available or may not be sought in every country in which our products are made available, and contractual disputes may affect the use of marks governed by private contract. Our registered or unregistered trademarks or trade names may be challenged, infringed, circumvented or declared generic or determined to be infringing on other marks. Further, at times, competitors may adopt trade names or trademarks similar to ours, thereby impeding our ability to build brand identity and possibly leading to market confusion. In addition, there could be potential trade name or trademark infringement claims brought by owners of other trademarks or trademarks that incorporate variations of our registered or unregistered trademarks or trade names. Over the long term, if we are unable to establish name recognition based on our trademarks and trade names, then we may not be able to compete effectively and our business may be adversely affected. Similarly, not every variation of a domain name may be available or be registered, even if available. The occurrence of any of these events could result in the erosion of our brands and limit our ability to market our brands using our various domain names, as well as impede our ability to effectively compete against competitors, any of which could materially adversely affect our business, financial condition and results of operations. We also rely on agreements under which we contract to own, or license rights to use, intellectual property developed by employees, contractors and other third parties. In addition, while we generally enter into confidentiality agreements with our employees and third parties to protect our trade secrets, know-how, business strategy and other proprietary information, such confidentiality agreements could be breached or otherwise may not provide meaningful protection for our trade secrets and know-how related to the design or manufacture of our products.
Similarly, while we seek to enter into agreements with all of our employees who develop intellectual property during their employment to assign the rights in such intellectual property to us, we may fail to enter into such agreements with all relevant employees, such agreements may be breached or may not be self-executing, and we may be subject to claims that such employees misappropriated relevant rights from their previous employers. Accordingly, we cannot guarantee that the steps we have taken to protect our intellectual property will be adequate to prevent infringement, misappropriation or other violations of our intellectual property rights, that we have secured, or will be able to secure, appropriate permissions or protections for all of the intellectual property rights we use or claim rights to, or that third parties will not terminate our license rights. Furthermore, even if we are able to obtain and maintain any intellectual property rights, any such rights may be challenged, invalidated, circumvented, infringed, misappropriated or otherwise violated. Any challenge to our intellectual property rights could result in our intellectual property rights being narrowed in scope or declared invalid or unenforceable. If we fail to protect our intellectual property rights adequately, we may lose an important advantage in the markets in which we compete.
Although we take aggressive legal and other actions to pursue those who infringe on our intellectual property rights, we cannot guarantee that the actions we take will be adequate to protect our brands in the future, especially because some countries’ laws do not protect intellectual property rights to the same extent as U.S. and Australian laws. For example, effective patent, trademark, copyright and trade secret protection may be unavailable or limited in some of the countries in which we operate. Policing unauthorized use of our intellectual property may also be difficult, expensive, and time-consuming, particularly in such foreign countries where mechanisms for enforcement of intellectual property rights may be weak. We may not be able to detect unauthorized use of, or take appropriate steps to enforce, our intellectual property rights, or pursue all counterfeiters who may seek to benefit from our brands. Furthermore, intellectual property laws and our procedures and restrictions provide only limited protection and any of our intellectual property rights may be challenged, invalidated, circumvented, infringed or misappropriated. If we fail to adequately protect our intellectual property rights, it would allow our competitors to sell products that are similar to and directly competitive with our products, which could reduce sales of our products. In addition, any intellectual property lawsuits in which we are involved could cost a significant amount of time and money and distract management’s attention from operating our business, which may negatively impact our business and results of operations.
The success of our brands has also made us the target of counterfeiting and product imitation strategies. We continue to be vulnerable to such infringements despite our dedication of significant resources to the registration and protection of our intellectual property and to anti-counterfeiting efforts worldwide. If we fail to prevent counterfeiting or imitation of our products, we could lose opportunities to sell our products to consumers who may instead purchase a counterfeit or imitation product. In addition, if our products are associated with inferior products due to infringement by others of our intellectual property, it could adversely affect the value of our brands and trademarks or trade names.
In order to protect our intellectual property rights, we may be required to spend significant resources to monitor for infringement and protect these rights. Litigation may be necessary in the future to enforce our intellectual property rights and to protect our trade secrets, which could be costly, time consuming and distracting to management and could result in the impairment or loss of portions of our intellectual property. Furthermore, our efforts to enforce our intellectual property rights may be met with defenses, counterclaims and countersuits attacking the validity and enforceability of our intellectual property rights. Any court decision or settlement that prevents trademark protection of our brands, that allows a third-party to continue to sell products similar to our products, or that allows a manufacturer or distributor to continue to sell counterfeit versions of our products, could lead to intensified competition and a material reduction in our sales.
We are subject to payments-related risks.
We accept payments using a variety of methods, including credit card, debit card, credit accounts (including promotional financing), gift cards, direct debit from a customer’s bank account, consumer invoicing, physical bank check, cryptocurrencies, and payment upon delivery. For existing and future payment options we offer to our customers, we currently are subject to, and may become subject to additional, regulations and compliance requirements (including obligations to implement enhanced authentication processes that could result in significant costs and reduce the ease of use of our payments products), as well as fraud. For certain payment methods, including credit and debit cards, we pay interchange and other fees, which may increase over time and raise our operating costs and lower profitability. We rely on third parties to provide certain payment methods and payment processing services, including the processing of credit cards, debit cards, electronic checks, cryptocurrencies, and promotional financing. In each case, it could disrupt our business if these companies become unwilling or unable to provide these services to us. We are also subject to payment card association operating rules, including data security rules, certification requirements, and rules governing electronic funds transfers, which could change or be reinterpreted to make it difficult or impossible for us to comply. Failure to comply with these rules or requirements could result in our being liable for card issuing banks’ costs, subject to fines and higher transaction fees, and loss of our ability to accept credit and debit card payments from our customers, process electronic funds transfers, or facilitate other types of online payments, and our business and operating results could be adversely affected.
Additionally, we have in the past incurred and may in the future incur losses from various types of fraud, including stolen credit card numbers, claims that a customer did not authorize a purchase, merchant fraud and customers who have closed bank accounts or have insufficient funds in open bank accounts to satisfy payments. Although we have measures in place to detect and reduce the occurrence of fraudulent activity in our marketplace, those measures may not always be effective. In addition to the direct costs of such losses, if the fraud is related to credit card transactions and becomes excessive, it could potentially result in us paying higher fees or losing the right to accept credit cards for payment. In addition, under current credit card practices, we are liable for fraudulent credit card transactions because we do not obtain a cardholder’s signature. Our failure to adequately prevent fraudulent transactions could damage our reputation, result in litigation or regulatory action and lead to expenses that could substantially impact our operating results.
In addition, we provide regulated services in certain jurisdictions because we enable customers to keep account balances with us and transfer money to third parties, and because we provide services to third parties to facilitate payments on their behalf. Jurisdictions subject us to requirements for licensing, regulatory inspection, bonding and capital maintenance, the use, handling, and segregation of transferred funds, consumer disclosures, maintaining or processing data, and authentication. We are also subject to or voluntarily comply with a number of other laws and regulations relating to payments, money laundering, international money transfers, privacy, data protection, data security, network security, consumer protection, and electronic fund transfers. If we were found to be in violation of applicable laws or regulations, we could be subject to additional requirements and civil and criminal penalties, or forced to cease providing certain services.
System interruptions that impair customer access to our sites or other performance failures in our technology infrastructure could damage our business, reputation and brand and substantially harm our business and results of operations.
The satisfactory performance, reliability and availability of our sites, transaction-processing systems and technology infrastructure are critical to our reputation and our ability to acquire and retain customers, as well as maintain adequate customer service levels.
If the facilities where the computer and communications hardware are located fail, or if our partners suffer an interruption or degradation of services at our main facility, we could lose customer data and miss order fulfillment deadlines, which could harm our business. Our partners’ systems and operations are vulnerable to damage or interruption from a variety of sources, including fire, flood, power loss, telecommunications or network failure, system malfunction, terrorist attacks, cyber-attacks, data loss, acts of war, break-ins, earthquakes and other natural disasters and similar events. In the event of a failure of our main facility, the failover to our back-up facility could take substantial time, during which time our sites could be completely shut down. Our partners’ back-up facilities are designed to support transaction volume at a level slightly above our average daily sales, but are not adequate to support spikes in demand. The back-up facilities may not process effectively during time of higher traffic to our sites, may process transactions more slowly and may not support all of our sites’ functionality.
We rely on our partners who use complex custom-built proprietary software in our technology infrastructure, which they seek to continually update and improve. Our partners may not always be successful in executing these upgrades and improvements, and the operation of our systems may be subject to failure. In particular, our partners have in the past and may in the future experience slowdowns or interruptions in some or all of our sites when they are updating them, and new technologies or infrastructures may not be fully integrated with existing systems on a timely basis, or at all. Additionally, if our partners expand their use of third-party services, including cloud-based services, our technology infrastructure may be subject to increased risk of slowdown or interruption as a result of integration with such services and/or failures by such third parties, which are out of our and their control. Our net sales depend on the number of visitors who shop on our sites and the volume of orders we can handle. Unavailability of our sites or reduced order fulfillment performance would reduce the volume of goods sold and could also materially adversely affect consumer perception of our brand. Our partners may experience periodic system interruptions from time to time. In addition, continued growth in our transaction volume, as well as surges in online traffic and orders associated with promotional activities or seasonal trends in our business, place additional demands on our partners’ technology platforms and could cause or exacerbate slowdowns or interruptions. If there is a substantial increase in the volume of traffic on our sites or the number of orders placed by customers, our partners will be required to further expand, scale and upgrade their technology, transaction processing systems and network infrastructure. There can be no assurance that our partners will be able to accurately project the rate or timing of increases, if any, in the use of our sites or expand, scale and upgrade our technology, systems and infrastructure to accommodate such increases on a timely basis. In order to remain competitive, our partners must continue to enhance and improve the responsiveness, functionality and features of our sites, which is particularly challenging given the rapid rate at which new technologies, customer preferences and expectations and industry standards and practices are evolving in the eCommerce industry. Accordingly, our partners redesign and enhance various functions on our sites on a regular basis, and we may experience instability and performance issues as a result of these changes. Any slowdown or failure of our sites and the underlying technology infrastructure could harm our business, reputation and our ability to acquire, retain and serve our customers, which could materially adversely affect our results of operations and our business interruption insurance may not be sufficient to compensate us for the losses that could occur.
Significant disruption during our live events may adversely affect our business.
We operate and host numerous live events each year, many of which are attended by a large number of people. There are many risks that are inherent in large gatherings of people, including the risk of an actual or threatened terrorist act, fire, explosion, protests, shooting incidents and riots, and other safety or security issues, any one of which could result in injury or death to attendees and/or damage to the facilities at which such an event is hosted, and the risk of a COVID-19 “superspreader” event. While we maintain insurance policies, they may be insufficient to reimburse us for all losses or all types of claims that may be caused by such an event. Moreover, if there were a public perception that the safety or security measures are inadequate at the events we host, whether or not the case, it could result in reputational damage and a decline in future attendance at events hosted by us. Any one of these things could harm our business.
We are subject to risks related to accepting cryptocurrencies as a form of payment.
We have in the past accepted, and may in the future accept, bitcoin or other cryptocurrencies from our customers as a form of payment for purchase on our Australian platforms. Cryptocurrencies are not considered legal tender or backed by any government and have experienced price volatility, technological glitches and various law enforcement and regulatory interventions. The use of cryptocurrency such as bitcoin has been prohibited or effectively prohibited in some countries. If we fail to comply with any such prohibitions that may be applicable to us, we could face regulatory or other enforcement actions and potential fines and other consequences.
At present, we do not accept bitcoin or other cryptocurrency directly, but use a third party vendor to accept such payments on our behalf. Our third party vendor then immediately converts such payments into Australian dollars so that we receive payment for the product sold at the sales price in Australian dollars. Accordingly, we do not hold any amount of cryptocurrency at any point during our transactions and are not subject to exchange risk. An insolvency of our third party vendor, however, may result in the cash receivable from them being unrecoverable.
In addition, there is substantial uncertainty regarding the future legal and regulatory requirements relating to cryptocurrency or transactions utilizing cryptocurrency. For instance, governments may in the near future curtail or outlaw the acquisition, use or redemption of cryptocurrencies. In such case, ownership of, holding or trading in cryptocurrencies may then be considered illegal and subject to sanction. These uncertainties, as well as future accounting and tax developments, or other requirements relating to cryptocurrency, could have a material adverse effect on our business.
Risks Relating to Our Organizational Structure
We have a short operating history as a holding company and, as a result, our past results may not be indicative of future operating performance.
We have a short operating history that may not develop in a manner favorable to our business or our investors expectations. Our relatively short operating history as a holding company, combined with the rapidly evolving nature of the industry in which we operate, substantial uncertainty concerning how our industry may develop and other factors beyond our control, makes it difficult to assess our future performance, as we may face difficulties in forecasting and managing the financial information of a group of our distinct brands. You should consider our business and prospects in light of the risks and difficulties we may encounter.
Our future success will depend in large part upon our ability to, among other things:
•cost-effectively acquire new customers and engage with existing customers;
•overcome the impacts of the COVID-19 pandemic;
•increase our market share and successfully expand our offering and geographic reach, including through acquisitions;
•increase customer awareness of our brands and maintain our reputation;
•anticipate and respond to macroeconomic changes;
•anticipate and respond to changing style trends and consumer preferences;
•manage our inventory effectively;
•compete effectively;
•avoid interruptions in our business from IT downtime, cybersecurity breaches, or labor stoppages;
•effectively manage our growth;
•hire, integrate, and retain talented people at all levels of our organization;
•maintain the quality of our IT infrastructure;
•develop new features to enhance the customer experience; and
•retain our existing merchandise suppliers and attract new suppliers.
If we fail to address the risks and difficulties that we face, including those associated with the challenges listed above as well as those described elsewhere in this “Risk Factors” section, our business and our operating results may be adversely affected.
Our decentralized brand management structure could negatively impact our business.
We cannot be certain that our brand management structure will be adequate to support our operations as they expand. In order to maintain the identity of each of our brands, we utilize a decentralized brand structure which places significant control and decision-making powers in the hands of the management of each of our brands. This contributes to the risk that we may be slower or less able to identify or react to problems affecting key business matters than we would in a more centralized environment. The lack of timely access to information may also impact the quality of decision making by management. For example, our ability to coordinate and utilize resources depends on effective communications and processes among our brands. As a result, the ability to internally communicate, coordinate and execute business strategies, plans and tactics may be negatively impacted by our increasing size and complexity. Our decentralized organization can also result in our brands assuming excessive risk without appropriate guidance from our centralized legal, accounting, safety, tax, treasury and insurance functions. Future growth could also impose significant additional responsibilities on members of our senior management, and we cannot be certain that we will be able to recruit, integrate and retain new senior level managers and executives. To the extent that we are unable to manage our growth effectively or are unable to attract and retain additional qualified management, we may not be able to expand our operations or execute our business plan.
Our management team has limited experience managing a public company.
Our management team has limited experience managing a publicly traded company, interacting with public company investors, and complying with the increasingly complex laws pertaining to public companies. Our management team may not successfully or efficiently manage our transition to being a public company subject to significant regulatory oversight and reporting obligations under the federal securities laws and the continuous scrutiny of securities analysts and investors. These new obligations and constituents will require significant attention from our senior management and could divert their attention away from the day-to-day management of our business, which could adversely affect our business, operating results, and financial condition.
If we cannot maintain our corporate culture as we grow and mature as a public company, our business may be harmed.
We believe that our corporate culture has been a critical component to our success and that our culture creates an environment that drives our employees and perpetuates our overall business strategy. We have invested substantial time and resources in building our team and we expect to continue to hire aggressively as we expand, including with respect to our international operations. As we grow and mature as a public company and grow internationally, we may find it difficult to maintain our corporate culture or the culture of our individual brands. Any failure to preserve our culture or the culture of our brands could negatively affect our future success, including our ability to recruit and retain personnel and effectively focus on and pursue our business strategy.
Risks Relating to our Indebtedness
Any indebtedness we may incur in the future could adversely affect our business and growth prospects.
We entered into a new credit facility concurrently with the completion of our initial public offering (“IPO”). Any indebtedness we may incur under our new credit facility, or any other indebtedness we may incur in the future, could require us to divert funds identified for other purposes for debt service and impair our liquidity position. If we cannot generate sufficient cash flow from operations to service our debt, we may need to refinance our debt, dispose of assets or issue equity to obtain necessary funds. We do not know whether we will be able to take any of these actions on a timely basis, on terms satisfactory to us or at all.
Our new credit facility, or any future credit facility or other indebtedness we may enter into, may have important consequences, including:
•limiting funds otherwise available for financing our capital expenditures by requiring us to dedicate a portion of our cash flows from operations to the repayment of debt and the interest on this debt;
•limiting our ability to incur additional indebtedness;
•limiting our ability to capitalize on significant business opportunities;
•making us more vulnerable to rising interest rates; and
•making us more vulnerable in the event of a downturn in our business.
Our level of indebtedness may place us at a competitive disadvantage to our competitors that are not as highly leveraged. Fluctuations in interest rates can increase borrowing costs. Increases in interest rates may directly impact the amount of interest we are required to pay and reduce earnings accordingly. In addition, developments in tax policy, such as the disallowance of tax deductions for interest paid on outstanding indebtedness, could have an adverse effect on our liquidity and our business, financial conditions and results of operations. Further, our new credit facility will likely contain customary affirmative and negative covenants and certain restrictions on operations that could impose operating and financial limitations and restrictions on us, including restrictions on our ability to enter into particular transactions and to engage in other actions that we may believe are advisable or necessary for our business.
We expect to use cash flow from operations to meet current and future financial obligations, including funding our operations, debt service requirements and capital expenditures. The ability to make these payments depends on our financial and operating performance, which is subject to prevailing economic, industry and competitive conditions and to certain financial, business and other factors beyond our control.
Despite current indebtedness levels and restrictive covenants, we may still be able to incur substantially more indebtedness or make certain restricted payments, which could further exacerbate the risks associated with our substantial indebtedness.
We may be able to incur significant additional indebtedness in the future. Although the financing documents that govern our new credit facility contain restrictions on the incurrence of additional indebtedness and liens, these restrictions are subject to a number of important qualifications and exceptions, and the additional indebtedness and liens incurred in compliance with these restrictions could be substantial.
The financing documents that govern our new credit facility permit us to incur certain additional indebtedness, including liabilities that do not constitute indebtedness as may be defined in such financing documents. We may also consider investments in joint ventures or acquisitions, which may increase our indebtedness. In addition, the financing documents that govern our new credit facility do not restrict our Principal Stockholder from creating new holding companies that may be able to incur indebtedness without regard to the restrictions set forth in the financing documents governing our new credit facility. If additional new debt is added to our currently anticipated indebtedness levels, the related risks that we face could intensify.
We may not be able to generate sufficient cash flow to service all of our indebtedness, and may be forced to take other actions to satisfy our obligations under such indebtedness, which may not be successful.
Our ability to make scheduled payments or to refinance outstanding debt obligations depends on our financial and operating performance, which will be affected by prevailing economic, industry and competitive conditions and by financial, business and other factors beyond our control. We may not be able to maintain a sufficient level of cash flow from operating activities to permit us to pay the principal, premium, if any, and interest on the our indebtedness. Any failure to make payments of interest and principal on our outstanding indebtedness on a timely basis would likely result in a reduction of our credit rating, which would also harm our ability to incur additional indebtedness.
If our cash flows and capital resources are insufficient to fund our debt service obligations, we may be forced to reduce or delay capital expenditures, sell assets, seek additional capital or seek to restructure or refinance our indebtedness. Any refinancing of our indebtedness could be at higher interest rates and may require us to comply with more onerous covenants. These alternative measures may not be successful and may not permit us to meet our scheduled debt service obligations. In the absence of such cash flows and resources, we could face substantial liquidity problems and might be required to sell material assets or operations to attempt to meet our debt service obligations. The financing documents that govern our new credit facility include certain restrictions on our ability to conduct asset sales and/or use the proceeds from asset sales for general corporate purposes. We may not be able to consummate these asset sales to raise capital or sell assets at prices and on terms that we believe are fair and any proceeds that we do receive may not be adequate to meet any debt service obligations then due. If we cannot meet our debt service obligations, the holders of our indebtedness may accelerate such indebtedness and, to the extent such indebtedness is secured, foreclose on our assets. In such an event, we may not have sufficient assets to repay all of our indebtedness.
The terms of the financing documents that govern our new credit facility restrict our current and future operations, particularly our ability to respond to changes or to take certain actions.
The financing documents that govern our new credit facility contain a number of restrictive covenants that impose significant operating and financial restrictions on us and may limit our ability to engage in acts that may be in our long-term best interests, including restrictions on our ability to:
•incur additional indebtedness or other contingent obligations;
•create or incur liens;
•make investments, acquisitions, loans and advances;
•wind up, consolidate, merge, liquidate or dissolve;
•sell, lease, transfer or otherwise dispose of our assets, including capital stock of our subsidiaries;
•pay dividends on our equity interests or make other payments in respect of capital stock;
•engage in transactions with our affiliates;
•make payments in respect of indebtedness secured on a junior lien basis, unsecured indebtedness and subordinated debt;
•modify organizational documents in a manner that is materially adverse to the lenders under the new credit facility;
•enter into burdensome agreements with negative pledge clauses or restrictions on subsidiary distributions;
•materially alter the business we conduct; and
•change our fiscal year.
You should read the discussion under the heading “Description of Indebtedness” for further information about these covenants.
The restrictive covenants in the financing documents governing our new credit facility require us to maintain specified financial ratios and satisfy other financial condition tests. Our ability to meet those financial ratios and tests can be affected by events beyond our control.
A breach of the covenants or restrictions under the financing documents that govern our new credit facility could result in an event of default under such documents. Such a default may allow the creditors to accelerate the related debt, which may result in the acceleration of any other debt to which a cross-acceleration or cross-default provision applies. In the event the holders of our indebtedness accelerate the repayment, we may not have sufficient assets to repay that indebtedness or be able to borrow sufficient funds to refinance it. Even if we are able to obtain new financing, it may not be on commercially reasonable terms or on terms acceptable to us. As a result of these restrictions, we may:
•be limited in how we conduct our business;
•be unable to raise additional debt or equity financing to operate during general economic conditions;
•experience business downturns; or
•be unable to compete effectively or to take advantage of new business opportunities.
These restrictions, along with restrictions that may be contained in agreements evidencing or governing other future indebtedness, may affect our ability to grow in accordance with our growth strategy.
We may be unable to refinance our indebtedness.
We may need to refinance all or a portion of our indebtedness before maturity. We cannot assure you that we will be able to refinance any of our indebtedness on commercially reasonable terms, or at all. There can be no assurance that we will be able to obtain sufficient funds to enable us to repay or refinance our debt obligations on commercially reasonable terms, or at all.
Changes in the method of determining LIBOR, or the replacement of LIBOR with an alternative reference rate, may adversely affect interest expense related to outstanding debt.
Borrowings under our Credit Facilities bear interest at the London Interbank Offered Rate (“LIBOR”) plus an applicable margin. On July 27, 2017, the Financial Conduct Authority (“FCA”) in the United Kingdom, which regulates LIBOR, announced that it intends to phase out LIBOR as a benchmark by the end of 2021. On November 30, 2020, ICE Benchmark Administration (“IBA”), the administrator of LIBOR, announced plans to consult on ceasing publication of most USD LIBOR tenors beyond June 30, 2023. On March 5, 2021, IBA confirmed it would cease publication of Overnight, 1, 3, 6 and 12 Month USD LIBOR settings immediately following the LIBOR publication on June 30, 2023. IBA also ceased publishing 1 Week and 2 Month USD LIBOR settings immediately following the LIBOR publication on December 31, 2021. Our Credit Facilities, which have terms that extend beyond 2021, provide for a mechanism to establish an alternate rate of interest upon the occurrence of certain events related to the phase-out of any applicable interest rate. The overall financial markets may be disrupted as a result of the phase-out or replacement of LIBOR. Uncertainty as to the nature of such potential phase-out and alternative reference rates or disruption in the financial market could have a material adverse effect on our cost of capital, financial condition, cash flows and results of operations.
A lowering or withdrawal of the ratings assigned to our debt securities by rating agencies may increase our future borrowing costs and reduce our access to capital.
Our debt currently has a non-investment grade rating, and any rating assigned could be lowered or withdrawn entirely by a rating agency if, in that rating agency’s judgment, future circumstances relating to the basis of the rating, such as adverse changes, so warrant. Any future lowering of our ratings likely would make it more difficult or more expensive for us to obtain additional debt financing.
Our failure to raise additional capital or generate cash flows necessary to expand our operations and invest in the future could reduce our ability to compete successfully and harm our results of operations.
We may need to raise additional funds, and we may not be able to obtain additional debt or equity financing on favorable terms or at all. If we raise additional equity financing, you may experience significant dilution of your ownership interests. If we raise additional debt financing, we may be required to accept terms that restrict our ability to incur additional indebtedness, force us to maintain specified liquidity or other ratios or restrict our ability to pay dividends or make acquisitions. If we need additional capital and cannot raise it on acceptable terms, or at all, we may not be able to, among other things:
•invest in our business and continue to expand our sales and marketing efforts;
•hire, train and retain employees;
•respond to competitive pressures or unanticipated working capital requirements; or
•pursue acquisition opportunities, including new brands, the inability of which could adversely impact the execution of our growth strategy.
Risks Relating to Ownership of Our Common Stock
Summit controls us, and its interests may conflict with ours or yours in the future.
At February 25, 2022, Summit beneficially owned approximately 56.5% of our common stock which means that, based on its percentage voting power, Summit controls the vote of all matters submitted to a vote of our Board or shareholders, which enables it to control the election of the members of the Board and all other corporate decisions. In addition, our bylaws provide that Summit has the right to designate the Chairman of the Board for so long as it beneficially owns at least 30% of the voting power of the then outstanding shares of our common stock then entitled to vote generally in the election of directors. Even when it ceases to own shares of our common stock representing a majority of the total voting power, for so long as it continues to own a significant portion of our common stock, Summit will still be able to significantly influence the composition of our Board, including the right to designate the Chairman of our Board, and the approval of actions requiring shareholder approval. Accordingly, for such period of time, Summit will have significant influence with respect to our management, business plans, and policies, including the appointment and removal of our officers, decisions on whether to raise future capital and decisions on whether to amend our certificate of incorporation and bylaws, which govern the rights attached to our common stock. In particular, for so long as Summit continues to own a significant percentage of our common stock, Summit will be able to cause or prevent a change of control of us or a change in the composition of our Board, including the selection of the Chairman of our Board, and could preclude any unsolicited acquisition of us. The concentration of ownership could deprive you of an opportunity to receive a premium for your shares of common stock as part of a sale of us and ultimately might affect the market price of our common stock.
In addition, in connection with our IPO, we entered into a Director Nomination Agreement with Summit that provides Summit the right to designate the following number of nominees for election to our Board: (i) all of the nominees for election to our Board for so long as Summit beneficially owns at least 40% of the total number of shares of our common stock outstanding upon completion of this offering, as adjusted for any reorganization, recapitalization, stock dividend, stock split, reverse stock split, or similar changes in the Company’s capitalization (the “Original Amount”); (ii) a majority of the nominees for election to our Board for so long as Summit beneficially owns less than 40% but at least 30% of the Original Amount; (iii) 30% of the nominees for election to our Board for so long as Summit beneficially owns less than 30% but at least 20% of the Original Amount; (iv) 20% of the nominees for election to our Board for so long as Summit beneficially owns less than 20% but at least 10% of the Original Amount; and (v) one of the nominees for election to our Board for so long as Summit beneficially owns at least 5% of the Original Amount, which could result in representation on our Board that is disproportionate to Summit’s beneficial ownership.
Summit and its affiliates engage in a broad spectrum of activities, including investments in the services industry generally. In the ordinary course of their business activities, Summit and its affiliates may engage in activities where their interests conflict with our interests or those of our other shareholders, such as investing in or advising businesses that directly or indirectly compete with certain portions of our business or are suppliers or customers of ours. Our certificate of incorporation provides that none of Summit, any of its affiliates or any director who is not employed by us (including any non-employee director who serves as one of our officers in both his director and officer capacities) will have any duty to refrain from engaging, directly or indirectly, in the same business activities or similar business activities or lines of business in which we operate. Summit also may pursue acquisition opportunities that may be complementary to our business, and, as a result, those acquisition opportunities may not be available to us. In addition, Summit may have an interest in pursuing acquisitions, divestitures and other transactions that, in its judgment, could enhance its investment, even though such transactions might involve risks to you.
An active trading market for our common stock may not develop.
Our IPO occurred in September 2021. Therefore, there has been a public market for our common stock for only a short period of time. Although we have listed our common stock on NYSE under the symbol “AKA,” an active trading market for our shares may not be sustained. A public trading market having the desirable characteristics of depth, liquidity and orderliness depends upon the existence of willing buyers and sellers at any given time, such existence being dependent upon the individual decisions of buyers and sellers over which neither we nor any market maker has control. The failure of an active and liquid trading market to develop and continue would likely have a material adverse effect on the value of our common stock. The market price of our common stock may decline below the public offering price, and you may not be able to sell your shares of our common stock at or above the price you paid, or at all. An inactive market may also impair our ability to raise capital to continue to fund operations by issuing shares and may impair our ability to acquire other companies or technologies by using our shares as consideration.
Our stock price may be volatile, and the market price of our common stock may drop below the price you pay.
Securities markets worldwide have experienced, and are likely to continue to experience, significant price and volume fluctuations. This market volatility, as well as general economic, market or political conditions, could subject the market price of our shares to wide price fluctuations regardless of our operating performance. The market price of our common stock may fluctuate significantly in response to a number of factors, many of which we cannot control, including those described under “—Risks Relating to Our Business and Strategy” and the following:
•changes in financial estimates by any securities analysts who follow our common stock, our failure to meet these estimates or failure of those analysts to initiate or maintain coverage of our common stock;
•downgrades by any securities analysts who follow our common stock or publications of these analysts of inaccurate or unfavorable research about our business;
•future sales of our common stock by our officers, directors and significant stockholders;
•market conditions or trends in our industry or the economy as a whole;
•investors’ perceptions of our prospects;
•announcements by us of significant contracts, acquisitions, joint ventures or capital commitments; and
•changes in key personnel.
In addition, in the past, when the market price of a stock has been volatile, holders of that stock have sometimes instituted securities class action litigation against the company that issued the stock. If any of our shareholders brought a lawsuit against us, we could incur substantial costs defending the lawsuit. Such a lawsuit could also divert the time and attention of our management from our business, which could significantly harm our profitability and reputation.
Our future operating results may fluctuate significantly and our current operating results may not be a good indication of our future performance. Fluctuations in our quarterly financial results could affect our stock price in the future.
Our revenues and operating results have historically varied from period-to-period and we expect that they will continue to do so as a result of a number of factors, many of which are outside of our control. If our quarterly financial results or our predictions of future financial results fail to meet the expectations of securities analysts and investors, our stock price could be negatively affected. Any volatility in our quarterly financial results may make it more difficult for us to raise capital in the future or pursue acquisitions that involve issuances of our stock. Our operating results for prior periods may not be effective predictors of future performance.
Factors associated with our industry, the operation of our business and the markets for our products and services may cause our quarterly financial results to fluctuate, including:
•the highly competitive nature of our industry;
•shortages of skilled labor and increased labor costs;
•actions of suppliers, customers and competitors, including merger and acquisition activities and financial failures; and
•cost of compliance with government laws and regulations.
Any one of the factors above or the cumulative effect of some of the factors referred to above may result in significant fluctuations in our quarterly financial and other operating results, including fluctuations in our key metrics. The variability and unpredictability could result in our failing to meet our internal operating plan or the expectations of securities analysts or investors for any period. If we fail to meet or exceed such expectations for these or any other reasons, the market price of our shares could fall substantially and we could face costly lawsuits, including securities class action suits.
As a result of becoming a public company, we are obligated to develop and maintain proper and effective internal control over financial reporting in order to comply with Section 404 of the Sarbanes-Oxley Act. If we fail to remediate our material weaknesses or if we fail to establish and maintain an effective system of internal control over financial reporting, we may not be able to accurately report our financial results, meet our reporting obligations, or prevent fraud. Failure to comply with requirements to design, implement and maintain effective internal controls or any inability to report and file our financial results accurately and timely could harm our business and adversely impact investor confidence in us and, as a result, our stock price.
Our management is responsible for establishing and maintaining adequate internal control over financial reporting. Internal control over financial reporting is a process designed to provide reasonable assurance regarding the reliability of financial reporting and the preparation of financial statements in accordance with GAAP. We are in the very early stages of the costly and challenging process of compiling the system and processing documentation necessary to perform the evaluation needed to comply with Section 404 of the Sarbanes-Oxley Act (“SOX”). We may not be able to complete our evaluation, testing and any required remediation in a timely manner. If we are unable to assert that our internal control over financial reporting is effective, we could lose investor confidence in the accuracy and completeness of our financial reports, which would cause the price of our common stock to decline, and we may be subject to investigation or sanctions by the SEC.
We will be required, pursuant to Section 404 of SOX, to furnish a report by management on, among other things, the effectiveness of our internal control over financial reporting as of the end of the fiscal year that coincides with the filing of our second Annual Report on Form 10-K (for fiscal year 2022). This assessment will need to include disclosure of any material weaknesses identified by our management in our internal control over financial reporting. We will also be required to disclose changes made in our internal control and procedures on a quarterly basis. However, our independent registered public accounting firm will not be required to report on the effectiveness of our internal control over financial reporting pursuant to Section 404 of SOX until the later of the year following our first annual report required to be filed with the SEC, or the date we are no longer an “emerging growth company” as defined in the Jumpstart Our Business Startups Act of 2012 (the “JOBS Act”) if we take advantage of the exemptions contained in the JOBS Act. At such time, our independent registered public accounting firm may issue a report that is adverse in the event it is not satisfied with the level at which our controls are documented, designed or operating.
As disclosed in our final prospectus filed with the SEC on September 23, 2021 pursuant to Rule 424(b) under the Securities Act of 1933, we identified three material weaknesses in the design and operation of our internal control over financial reporting in connection with the preparation of our financial statements for the fiscal years ended December 31, 2020 and 2019. A material weakness is a deficiency, or a combination of deficiencies, in internal control over financial reporting such that there is a reasonable possibility that a material misstatement of a company’s annual or interim financial statements will not be prevented or detected on a timely basis. Our evaluation was based on the Committee of Sponsoring Organizations of the Treadway Commission (“COSO”) Internal Control — Integrated Framework (2013).
The material weaknesses identified by management related to the following:
•We have not sufficiently designed, implemented and documented internal controls at the entity level and across the key business and financial processes to allow us to achieve complete, accurate and timely financial reporting.
•We have not designed and implemented controls to maintain appropriate segregation of duties in our manual and IT-based business processes.
•We have insufficient resources with the appropriate knowledge and experience in our accounting function related to GAAP and the SEC reporting requirements of a U.S. domestic registrant to enable us to design and maintain an effective financial reporting process.
Since identifying the first and second material weaknesses, we have been, and are currently in the process of, remediating each of these. Although we plan to complete the remediation process as quickly as possible for each material weakness, we cannot at this time estimate when the remediation will be completed. To address and remediate the third material weakness, the Company hired additional accounting and financial reporting personnel with extensive knowledge and experience related to U.S. GAAP and the SEC reporting requirements of U.S. domestic registrants. Accordingly, we believe we have remediated the material weakness that the Company has insufficient resources with the appropriate knowledge and experience to enable us to design and maintain an effective financial reporting process. For additional information, see “Controls and Procedures—Remediation Status of Material Weaknesses.”
We cannot assure you that the measures that we have taken, and that will be taken, to remediate the remaining material weaknesses will, in fact, remedy the material weaknesses or will be sufficient to prevent future material weaknesses from occurring. We also cannot assure you that we have identified all of our existing material weaknesses. In addition, prior acquisitions, such as the Culture Kings Acquisition, and future acquisitions may present challenges in implementing appropriate and effective internal controls. Any future material weaknesses in internal control over financial reporting could result in material misstatements in our financial statements.
Remediating material weaknesses will absorb management time and will require us to incur additional expenses, which could have a negative effect on the trading price of our shares. In order to establish and maintain effective disclosure controls and procedures and internal controls over financial reporting, we will need to expend significant resources and provide significant management oversight. Developing, implementing and testing changes to our internal controls may require specific compliance training of our directors and employees, entail substantial costs in order to modify our existing accounting systems, take a significant period of time to complete and divert management’s attention from other business concerns. These changes may not, however, be effective in establishing and maintaining adequate internal controls.
It is possible that, had we and our independent registered public accounting firm performed a formal assessment of the effectiveness of our internal control over financial reporting in accordance with the provisions of the Sarbanes-Oxley Act, additional material weaknesses may have been identified.
If either we are unable to conclude that we have effective internal controls over financial reporting or our independent registered public accounting firm is unable to provide us with an unqualified report on the effectiveness of our internal controls over financial reporting as required by Section 404(b) of the Sarbanes-Oxley Act, investors may lose confidence in our reported financial information, the price of our common stock could decline and we may be subject to litigation or regulatory enforcement actions. In addition, if we are unable to meet the requirements of Section 404 of the Sarbanes-Oxley Act, we may not be able to remain listed on the NYSE.
The requirements of being a public company with common stock listed on the NYSE will increase certain of our costs and require significant management focus.
As a public company, we incur legal, accounting and other expenses that we did not incur as a private company. We are subject to the reporting requirements of the Exchange Act and SOX, the listing requirements of NYSE and other applicable securities rules and regulations. Compliance with these rules and regulations continue to increase our legal and financial compliance costs, make some activities more difficult, time-consuming or costly and increase demand on our systems and resources, particularly after we are no longer an “emerging growth company.”
In addition, changing laws, regulations and standards relating to corporate governance and public disclosure are creating uncertainty for public companies, increasing legal and financial compliance costs and making some activities more time consuming. These laws, regulations and standards are subject to varying interpretations, in many cases due to their lack of specificity, and, as a result, their application in practice may evolve over time as new guidance is provided by regulatory and governing bodies. This could result in continuing uncertainty regarding compliance matters and higher costs necessitated by ongoing revisions to disclosure and governance practices. We intend to invest resources to comply with evolving laws, regulations and standards, and this investment may result in increased general and administrative expenses and a diversion of our management’s time and attention from sales-generating activities to compliance activities. If our efforts to comply with new laws, regulations and standards differ from the activities intended by regulatory or governing bodies due to ambiguities related to their application and practice, regulatory authorities may initiate legal proceedings against us and could have a material adversely effect on our business, financial condition and results of operations.
Future sales of our common stock, or the perception in the public markets that these sales may occur, may depress our stock price.
Sales of substantial amounts of our common stock in the public market, or the perception that these sales could occur, could adversely affect the price of our common stock and could impair our ability to raise capital through the sale of additional shares.
Each of us and the holders of our common stock outstanding immediately prior to the IPO entered into lock-up agreements with the underwriters of our IPO that restricted our ability to sell or transfer shares of common stock for a period of 180 days after the date of the IPO. These lock-up restrictions expire on March 20, 2022.
On September 23, 2021, we registered 7,044,138 shares of our common stock on Form S-8 under the Securities Act that we can issue pursuant to our various equity plans. Shares of such common stock if, when, and to the extent issued under these equity plans, will be available for sale in the open market.
Subject to any lock-up restrictions described above, certain holders of approximately 117,496,642 shares of our common stock have the right to require us to register the sales of their shares under the Securities Act, under the terms of a registration right agreement between us and the holders of these securities.
In the future, we may also issue our securities in connection with acquisitions or investments. The amount of shares of our common stock issued in connection with an acquisition or investment could constitute a material portion of our then-outstanding shares of our common stock.
For as long as we are an emerging growth company, we will not be required to comply with certain reporting requirements, including disclosure about our executive compensation that apply to other public companies.
We are an “emerging growth company,” as defined in the JOBS Act. As such, we are eligible to take advantage of certain exemptions from various reporting requirements that are applicable to other public companies that are not “emerging growth companies,” including, but not limited to, (1) not being required to comply with the auditor attestation requirements of Section 404(b) of the Sarbanes-Oxley Act, (2) reduced disclosure obligations regarding executive compensation in our periodic reports and proxy statements and (3) exemptions from the requirements of holding a non-binding advisory vote on executive compensation and of shareholder approval of any golden parachute payments not previously approved. If we choose not to comply with the auditor attestation requirements of Section 404 of the Sarbanes-Oxley Act, our auditors will not be required to attest to the effectiveness of our internal controls over financial reporting. As a result, investors may become less comfortable with the effectiveness of our internal controls and the risk that material weaknesses or other deficiencies in our internal control go undetected may increase. If we choose to provide reduced disclosures in our periodic reports and proxy statements while we are an emerging growth company, investors would have access to less information and analysis about our executive compensation, which may make it difficult for investors to evaluate our executive compensation practices. We cannot predict if investors will find our common stock less attractive as a result of our taking advantage of these exemptions and as a result, there may be a less active trading market for our common stock and our stock price may be more volatile.
We could remain an “emerging growth company” for up to five years or until the earliest of (a) the last day of the first fiscal year in which our annual gross revenue exceeds $1.07 billion, (b) the date that we become a “large accelerated filer” as defined in Rule 12b-2 under the Securities Exchange Act of 1934, as amended (the “Exchange Act”), which would occur if the market value of our common stock that is held by non-affiliates exceeds $700 million as of the last business day of our most recently completed second fiscal quarter, and (c) the date on which we have issued more than $1 billion in non-convertible debt securities during the preceding three- year period.
We are a “controlled company” within the meaning of the rules of the NYSE and, as a result, we qualify for, and intend to rely on, exemptions from certain corporate governance requirements. You will not have the same protections as those afforded to stockholders of companies that are subject to such governance requirements.
Summit controls a majority of the voting power of our outstanding common stock. As a result, we are a “controlled company” within the meaning of the corporate governance standards of the NYSE. Under these rules, a company of which more than 50% of the voting power for the election of directors is held by an individual, group or another company is a “controlled company” and may elect not to comply with certain corporate governance requirements, including:
•the requirement that a majority of our Board consist of independent directors;
•the requirement that we have a nominating and corporate governance committee that is composed entirely of independent directors with a written charter addressing the committee’s purpose and responsibilities;
•the requirement that we have a compensation committee that is composed entirely of independent directors with a written charter addressing the committee’s purpose and responsibilities; and
•the requirement for an annual performance evaluation of the nominating and corporate governance and compensation committees.
We intend to continue to utilize these exemptions. As a result, we currently do not have a majority of independent directors on our Board, our Compensation Committee and Nominating and Corporate Governance Committee do not consist entirely of independent directors and our Compensation Committee and Nominating and Corporate Governance Committee are not subject to annual performance evaluations. Accordingly, you will not have the same protections afforded to stockholders of companies that are subject to all of the corporate governance requirements of the NYSE.
Anti-takeover provisions in our certificate of incorporation documents and Delaware law might discourage or delay acquisition attempts for us that you might consider favorable.
In addition to Summit’s beneficial ownership of 56.5% of our common stock as of February 25, 2022, our certificate of incorporation and bylaws contain provisions that may make the acquisition of the Company more difficult without the approval of our board of directors. These provisions:
•authorize the issuance of undesignated preferred stock, the terms of which may be established and the shares of which may be issued without stockholder approval, and which may include super voting and special approval, dividend or other rights or preferences superior to the rights of the holders of common stock;
•prohibit stockholder action by written consent at any time when Summit controls, in the aggregate, less than 35% in voting power of our outstanding common stock;
•provide that the board of directors is expressly authorized to make, alter or repeal our bylaws;
•establish advance notice requirements for nominations for elections to our board of directors or for proposing matters that can be acted upon by stockholders at stockholder meetings; provided, however, at any time when Summit controls, in the aggregate, at least 10% in voting power of our outstanding common stock entitled to vote generally in the election of directors, such advance notice procedure will not apply to Summit;
•establish a classified board of directors, as a result of which our board of directors will be divided into three classes, with each class serving for staggered three-year terms, which prevents stockholders from electing an entirely new board of directors at an annual meeting;
•provide that, at any time when Summit controls, in the aggregate, less than 40% in voting power of our stock entitled to vote generally in the election of directors, directors may only be removed for cause, and only by the affirmative vote of holders of at least 66 2⁄3% in voting power of all the then-outstanding shares of our stock entitled to vote thereon, voting together as a single class;
•prohibit stockholders from calling special meetings of stockholders; provided, however, at any time when Summit controls, in the aggregate, at least 35% in voting power of our outstanding common stock, special meetings of our stockholders shall also be called by our Board or the Chairman of our Board at the written request of Summit; and
•require the approval of holders of at least 66 2/3% of the outstanding shares of our voting common stock to amend certain provisions of our certificate of incorporation and for stockholders to amend our bylaws.
Our certificate of incorporation also contains a provision that provides us with protections similar to Section 203 of the Delaware General Corporation Law (the “DGCL”), and prevents us from engaging in a business combination with a person (excluding Summit and its transferees) who acquires at least 15% of our common stock for a period of three years from the date such person acquired such common stock, unless board or stockholder approval is obtained prior to the acquisition. These anti-takeover provisions and other provisions under Delaware law could discourage, delay or prevent a transaction involving a change in control of the Company, even if doing so would benefit our stockholders. These provisions could also discourage proxy contests and make it more difficult for you and other stockholders to elect directors of your choosing and to cause us to take other corporate actions you desire.
Any issuance of preferred stock could make it difficult for another company to acquire us or could otherwise adversely affect holders of our common stock, which could depress the price of our common stock.
Our board of directors has the authority to issue preferred stock and to determine the preferences, limitations and relative rights of shares of preferred stock and to fix the number of shares constituting any series and the designation of such series, without any further vote or action by our stockholders. Our preferred stock could be issued with voting, liquidation, dividend and other rights superior to the rights of our common stock. The potential issuance of preferred stock may delay or prevent a change in control of us, discouraging bids for our common stock at a premium over the market price, and adversely affect the market price and the voting and other rights of the holders of our common stock.
Our certificate of incorporation designates the Court of Chancery of the State of Delaware as the exclusive forum for certain litigation that may be initiated by our shareholders and the federal district courts of the United States as the exclusive forum for litigation arising under the Securities Act, which could limit our shareholders’ ability to obtain a favorable judicial forum for disputes with us.
Pursuant to our certificate of incorporation, unless we consent in writing to the selection of an alternative forum, the Court of Chancery of the State of Delaware is the sole and exclusive forum for (1) any derivative action or proceeding brought on our behalf, (2) any action asserting a claim of breach of a fiduciary duty owed by any of our directors, officers or other employees to us or our shareholders, (3) any action asserting a claim against us arising pursuant to any provision of the DGCL, our certificate of incorporation or our bylaws or (4) any other action asserting a claim against us that is governed by the internal affairs doctrine; provided that for the avoidance of doubt, the forum selection provision that identifies the Court of Chancery of the State of Delaware as the exclusive forum for certain litigation, including any “derivative action”, will not apply to suits to enforce a duty or liability created by Securities Act, the Exchange Act or any other claim for which the federal courts have exclusive jurisdiction. Our certificate of incorporation also provided that unless we consent in writing to the selection of an alternative forum, the federal district courts of the United States shall be the exclusive forum for the resolutions of any complaint asserting a cause of action arising under the Securities Act.
Section 22 of the Securities Act creates concurrent jurisdiction for federal and state courts over all claims brought to enforce any duty or liability created by the Securities Act or the rules and regulations thereunder and our certificate of incorporation also provides that, unless we consent in writing to the selection of an alternative forum and to the fullest extent permitted by law, the federal district courts of the United States shall be the exclusive forum for the resolution of any complaint asserting a cause of action arising under the Securities Act. While there can be no assurance that federal or state courts will follow the holding of the Delaware Supreme Court or determine that our federal forum provision should be enforced in a particular case, application of our federal forum provision means that suits brought by our stockholders to enforce any duty or liability created by the Securities Act must be brought in federal court and cannot be brought in state court.
Section 27 of the Exchange Act creates exclusive federal jurisdiction over all claims brought to enforce any duty or liability created by the Exchange Act or the rules and regulations thereunder and our certificate of incorporation provides that neither the exclusive forum provision nor our federal forum provision applies to suits brought to enforce any duty or liability created by the Exchange Act. Accordingly, actions by our stockholders to enforce any duty or liability created by the Exchange Act or the rules and regulations thereunder must be brought in federal court. Our stockholders will not be deemed to have waived our compliance with the federal securities laws and the regulations promulgated thereunder.
Our certificate of incorporation further provides that any person or entity purchasing or otherwise acquiring any interest in shares of our capital stock is deemed to have notice of and consented to the provisions of our certificate of incorporation described above. The forum selection clause in our certificate of incorporation may have the effect of discouraging lawsuits against us or our directors and officers and may limit our shareholders’ ability to obtain a favorable judicial forum for disputes with us. If the enforceability of our forum selection provisions were to be challenged, we may incur additional costs associated with resolving such challenge. While we currently have no basis to expect any such challenge would be successful, if a court were to find our forum selection provisions to be inapplicable or unenforceable with respect to one or more of these specified types of actions or proceedings, we may incur additional costs associated with having to litigate in other jurisdictions, which could have an adverse effect on our business, financial condition, results of operations, cash flows, and prospects and result in a diversion of the time and resources of our employees, management, and board of directors.
Because we do not intend to pay cash dividends in the foreseeable future, you may not receive any return on investment unless you are able to sell your common stock for a price greater than your purchase price.
The continued operation and expansion of our business will require substantial funding. Accordingly, we do not anticipate that we will pay any cash dividends on shares of our common stock for the foreseeable future. Any determination to pay dividends in the future will be at the discretion of our board of directors and will depend upon results of operations, financial condition, contractual restrictions, including those under our senior secured credit facilities, any potential indebtedness we may incur, restrictions imposed by applicable law and other factors our board of directors deems relevant. Accordingly, if you purchase our common stock, realization of a gain on your investment will depend on the appreciation of the price of our common stock, which may never occur.
If securities or industry analysts do not publish research or reports about our business, if they adversely change their recommendations regarding our common stock or if our results of operations do not meet their expectations, the price of our common stock and trading volume could decline.
The trading market for our common stock will be influenced by the research and reports that industry or securities analysts publish about us or our business. We do not have any control over these analysts. If one or more of these analysts cease coverage of our Company or fail to publish reports on us regularly, we could lose visibility in the financial markets, which in turn could cause the price of our common stock or trading volume to decline. Moreover, if one or more of the analysts who cover us downgrade our common stock, or if our results of operations do not meet their expectations, the price of our common stock could decline.
We are a holding company and conduct all of our operations through our subsidiaries.
We are a holding company and derive all of our operating income from our subsidiaries. All of our assets are held by our direct and indirect subsidiaries. We rely on the earnings and cash flows of our subsidiaries, which are paid to us by our subsidiaries in the form of dividends and other payments or distributions, to meet our debt service obligations. The ability of our subsidiaries to pay dividends or make other payments or distributions to us will depend on their respective operating results and may be restricted by, among other things, the laws of their jurisdiction of organization (which may limit the amount of funds available for the payment of dividends and other distributions to us), the terms of existing and future indebtedness and other agreements of our subsidiaries and the covenants of any future outstanding indebtedness we or our subsidiaries incur.
ITEM 1B. UNRESOLVED STAFF COMMENTS
None.
ITEM 2. PROPERTIES
We lease three offices in Los Angeles, California, one office in Newark, New Jersey, three offices in Queensland, Australia, and our corporate headquarters is located at 100 Montgomery Street, Suite 1600, San Francisco, California 94104 (approximately 4,867 square feet). We lease and operate three distribution centers in Australia, but use third parties in the United States. The three distribution centers have lease terms expiring from July 2024 to January 2027. All have sufficient renewal periods. Culture Kings leases and operates seven physical retail stores in Australia and one in New Zealand. The eight retail stores have lease terms expiring from June 2022 to August 2031.
ITEM 3. LEGAL PROCEEDINGS
We are subject to legal proceedings which arise in the ordinary course of business. In the opinion of management, the amount of ultimate liability with respect to these legal proceedings will not have a material adverse impact on our financial position or results of operations and cash flows. While we currently believe that the ultimate outcome of such legal proceedings, individually and in the aggregate, will not have a material adverse effect on our financial position or results of operations, litigation is subject to inherent uncertainties. If an unfavorable ruling were to occur, there exists the possibility of a material adverse impact on our results of operations in the period in which the ruling occurs. The estimate of the potential impact from such legal proceedings on our financial position or results of operations could change in the future.
ITEM 4. MINE SAFETY DISCLOSURES
Not applicable.
PART II
ITEM 5. MARKET FOR REGISTRANT’S COMMON EQUITY, RELATED STOCKHOLDER MATTERS AND ISSUER PURCHASES OF SECURITIES
Market Information for Common Stock
Our common stock has traded on the New York Stock Exchange (“NYSE”) under the symbol “AKA” since our initial public offering on September 22, 2021. Prior to that date, there was no public market for our common stock.
Stockholders of Record
American Stock Transfer & Trust Company, LLC is the transfer agent and registrar for our common stock. As of February 25, 2022, there were 9 stockholders of record of our common stock. The actual number of stockholders is greater than this number and includes stockholders whose shares are held in street name by brokers and other nominees, and stockholders whose shares may be held in trust by other entities.
Dividend Policy
We have never declared or paid cash dividends on our capital stock. We currently intend to retain any future earnings to finance the development and expansion of our business and do not expect to declare or pay any dividends in the foreseeable future. Any further determination to pay dividends on our capital stock will be at the discretion of our board of directors, subject to applicable laws, and will depend on our financial condition, operating results, capital requirements, general business conditions, and other factors that our board of directors considers relevant. Our future ability to pay cash dividends on our capital stock is limited by the terms of our senior secured credit facility and may be limited by any future debt instruments or preferred securities.
Stock Performance Graph
The following shall not be deemed “soliciting material” or deemed “filed” for purposes of Section 18 of the Securities Exchange Act of 1934, as amended (the”Exchange Act”), or subject to Regulation 14A or 14C, other than as provided by this Item 5, or to the liabilities of Section 18 of the Exchange Act, or incorporated by reference into any of our other filings under the Exchange Act or the Securities Act of 1933, as amended (the “Securities Act”), except to the extent we specifically incorporate it by reference into such filing.
The following graph and table compare the cumulative total return on our common stock with that of the S&P 500 Index and the S&P Retail Select Industry Index during each monthly accounting period from September 22, 2021 (the date our common stock began trading on the NYSE) through December 31, 2021. The graph assumes $100 was invested in our common stock, the S&P 500 Index, and the S&P Retail Select Industry Index at the close of market on September 22, 2021, and assumes the reinvestment of any dividends. The returns shown are based on historical results and are not intended to suggest future performance.
| | | | | | | | | | | | | | | | | | | | | | | | | | | | | | | | |
| Company/Index | | 9/22/2021 | | 9/30/2021 | | 10/31/2021 | | 11/30/2021 | | 12/31/2021 |
| a.k.a. Brands Holding Corp. | | $ | 100.00 | | | $ | 85.69 | | | $ | 101.80 | | | $ | 118.62 | | | $ | 92.59 | |
| S&P 500 Index | | $ | 100.00 | | | $ | 98.02 | | | $ | 104.89 | | | $ | 104.17 | | | $ | 108.83 | |
| S&P Retail Select Industry Index | | $ | 100.00 | | | $ | 95.96 | | | $ | 100.10 | | | $ | 99.76 | | | $ | 97.02 | |
ITEM 6. SELECTED CONSOLIDATED FINANCIAL DATA
Not required.
ITEM 7. MANAGEMENT’S DISCUSSION AND ANALYSIS OF FINANCIAL CONDITION AND RESULTS OF OPERATIONS
You should read the following discussion and analysis of our financial condition and results of operations together with the consolidated financial statements and related notes that are included elsewhere in this Annual Report on Form 10-K. This discussion contains forward-looking statements based upon current plans, expectations and beliefs that involve risks and uncertainties. Our actual results may differ materially from those anticipated in these forward-looking statements because of various factors, including those set forth in the sections captioned “Risk Factors” and “Forward-Looking Statements” and in other parts of this Annual Report on Form 10-K. Our fiscal year ends on December 31.
Overview and Recent Highlights
Established in 2018, a.k.a. Brands is a brand accelerator of direct-to-consumer fashion brands for the next generation. Each brand in the a.k.a. portfolio is customer-led, curates quality exclusive merchandise, creates authentic and inspiring social content and targets a distinct Gen Z and Millennial audience. a.k.a. Brands leverages its next-generation retail platform to help each brand accelerate its growth, scale in new markets and enhance its profitability.
We founded a.k.a. with a focus on Millennial and Gen Z audiences who primarily shop for fashion on social media. We have since built a portfolio of five high-growth digital brands with distinct fashion offerings and consumer followings:
•In July 2018, we acquired Princess Polly, an Australian fashion brand focusing on fun, trendy dresses, tops, shoes and accessories with slim fit, body-confident and trendy fashion designs. The brand targets a female customer between the ages of 15 and 25. Princess Polly has successfully expanded in the U.S., growing U.S. sales by 80% in 2021 as compared to 2020.
•In August 2019, we acquired a controlling interest in Petal & Pup, an Australian fashion brand offering an assortment of trendy, flattering and feminine styles and dresses for special occasions. We acquired the remaining noncontrolling interest in tandem with our IPO. The brand targets female customers typically in their 20s or 30s, with more than half of customers in the 18-34-year-old age bracket. Since joining a.k.a., Petal & Pup has successfully expanded in the U.S., which was the brand’s fastest growing market in 2021.
•In December 2019, we acquired U.S.-based Rebdolls. The brand offers apparel with a full range of sizes from 0 to 32 and emphasizes size inclusivity. The typical customer is a diverse woman between the ages of 18 and 34.
•In March 2021, we acquired a controlling interest in Culture Kings, an Australia-based premium online retailer of streetwear apparel, footwear, headwear and accessories. We acquired the remaining noncontrolling interest in tandem with our IPO. The brand targets male consumers between the ages of 18 and 35 who are fashion conscious, highly social and digitally focused.
•In October 2021, we acquired mnml, an LA-based streetwear brand that offers competitively priced on-trend wardrobe staples. The brand targets male consumers between the ages of 18 and 35.
While we have owned Princess Polly, Petal & Pup and Rebdolls from before 2020, information presented hereafter on an “across a.k.a. Brands” basis assumes we also owned Culture Kings for all periods presented.
Across a.k.a. Brands for 2021, we attracted over 3.7 million active customers (a 61% increase from 2020), received 7.0 million orders (a 48% increase from 2020) and increased average order value from $81 to $87 (an approximately 7% increase from 2020).
In addition, our brands demonstrated rapid growth and strong profitability and free cash flow generation. Our annual financial results discussed below represent the consolidated results of Princess Polly, Petal & Pup and Rebdolls for all of 2021 and 2020, and include nine months of Culture Kings operations from the date of their acquisition, March 31, 2021, as well as over two months of mnml’s operations from the date of their acquisition, October 14, 2021. Results for 2019, as compared to 2020, include Princess Polly for all twelve months and Petal & Pup and Rebdolls from the dates of acquisition, August 2019 and December 2019, respectively.
Initial Public Offering
In September 2021, we completed an initial public offering (the “IPO”), in which we issued and sold 10,000,000 shares of newly authorized common stock for $11.00 per share for net proceeds of $95.7 million, after deducting underwriting discounts and commissions of $6.6 million, and offering costs of $7.7 million.
Key Operating and Financial Metrics
Operating Metrics
We use the following metrics to assess the progress of our business, make decisions on where to allocate capital, time and technology investments and assess the near-term and longer-term performance of our business.
The following table sets forth our key operating metrics for each period presented.
| | | | | | | | | | | | | | | | | |
| Year Ended December 31, |
(in millions, other than dollar figures) | 2021 | | 2020 | | 2019 |
Active customers | 3.7 | | | 1.4 | | | 0.9 | |
Active customers across a.k.a. Brands(1) | 3.7 | | | 2.3 | | | 1.4 | |
Average order value | $ | 86 | | | $ | 75 | | | $ | 62 | |
Average order value across a.k.a. Brands(1) | $ | 87 | | | $ | 81 | | | $ | 71 | |
Number of orders | 6.5 | | | 2.9 | | | 1.7 | |
Number of orders across a.k.a. Brands(1) | 7.0 | | | 4.7 | | | 3.1 | |
(1) Includes the impact of Culture Kings as if we had owned it for all periods presented.
Active Customers
We view the number of active customers as a key indicator of our growth, the value proposition and consumer awareness of our brand, and their desire to purchase our products. In any particular period, we determine our number of active customers by counting the total number of unique customer accounts who have made at least one purchase in the preceding 12-month period, measured from the last date of such period.
Average Order Value
We define average order value as net sales in a given period divided by the total orders placed in that period. Average order value may fluctuate as we expand into new categories or geographies or as our assortment changes.
Key Financial Metrics
The following table sets forth our key GAAP and non-GAAP financial metrics for for each period presented:
| | | | | | | | | | | | | | | | | |
| Year Ended December 31, |
| 2021 | | 2020 | | 2019 |
Gross margin | 55 | % | | 59 | % | | 55% |
Net income (loss) (in thousands) | $ | (6,091) | | | $ | 14,805 | | | $ | 1,442 | |
Net income (loss) margin | (1) | % | | 7 | % | | 1% |
Adjusted EBITDA (in thousands) | $ | 62,431 | | | $ | 30,282 | | | $ | 9,173 | |
Adjusted EBITDA margin | 11 | % | | 14 | % | | 9 | % |
Net cash provided by operating activities (in thousands) | $ | 23,968 | | | $ | 21,712 | | | $ | 511 |
Free cash flow (in thousands) | $ | 16,234 | | | $ | 20,384 | | | $ | (520) |
Adjusted EBITDA, Adjusted EBITDA Margin and free cash flow are non-GAAP measures. See “Non-GAAP Financial Measures” for information regarding our use of Adjusted EBITDA, Adjusted EBITDA margin and free cash flow and their reconciliation to net income, net income margin and net cash provided by operating activities, respectively.
Non-GAAP Financial Measures
In addition to our results determined in accordance with GAAP, we monitor the following supplemental non-GAAP financial measures to evaluate our operating performance, identify trends, formulate financial projections and make strategic decisions on a consolidated basis. Accordingly, we believe that non-GAAP financial information, when taken collectively, may provide useful supplemental information to investors and others in understanding and evaluating our results of operations in the same manner as our management team. The non-GAAP financial measures are presented for supplemental informational purposes only. They should not be considered a substitute for financial information presented in accordance with GAAP, and may be different from similarly-titled non-GAAP measures used by other companies. A reconciliation is provided below for each non-GAAP financial measure to the most directly comparable financial measure stated in accordance with GAAP. Investors are encouraged to review the related GAAP financial measures and the reconciliation of these non-GAAP financial measures to their most directly comparable GAAP financial measures.
Adjusted EBITDA
Adjusted EBITDA does not represent net income or cash flow from operating activities as it is defined by GAAP and does not necessarily indicate whether cash flows will be sufficient to fund cash needs. Because other companies may calculate EBITDA and Adjusted EBITDA differently than we do, Adjusted EBITDA may not be comparable to similarly titled measures reported by other companies. Adjusted EBITDA has other limitations as an analytical tool when compared to the use of net income, which we believe is the most directly comparable GAAP financial measure, including:
•Adjusted EBITDA does not reflect the interest income or expense we incur;
•Adjusted EBITDA does not reflect the provision for or benefit from income tax;
•Adjusted EBITDA does not reflect any attribution of costs to our operations related to our investments and capital expenditures through depreciation and amortization charges;
•Adjusted EBITDA does not reflect any transaction or debt extinguishment costs;
•Adjusted EBITDA does not reflect any amortization expense associated with fair value adjustments from purchase price accounting, including intangibles or inventory step-up; and
•Adjusted EBITDA does not reflect the cost of compensation we provide to our employees in the form of equity awards.
The following table reflects a reconciliation of Adjusted EBITDA to net income, the most directly comparable financial measure prepared in accordance with GAAP:
| | | | | | | | | | | | | | | | | |
| Year Ended December 31, |
| In thousands | 2021 | | 2020 | | 2019 |
| | | | | |
| Net income (loss) | $ | (6,091) | | | $ | 14,805 | | | $ | 1,442 | |
| Add (deduct): | | | | | |
| Total other expense, net | 21,622 | | | 485 | | | 139 | |
| Provision for income tax | 852 | | | 6,850 | | | 1,012 | |
| Depreciation and amortization expense | 16,710 | | | 6,762 | | | 6,227 | |
| Inventory step-up amortization expense | 15,908 | | | — | | | — | |
| Equity-based compensation expense | 8,043 | | | 1,380 | | | 353 | |
| Transaction costs | 5,387 | | | — | | | — | |
| Adjusted EBITDA | $ | 62,431 | | | $ | 30,282 | | | $ | 9,173 | |
| Net income (loss) margin | (1) | % | | 7 | % | | 1 | % |
| Adjusted EBITDA margin | 11 | % | | 14 | % | | 9 | % |
Free Cash Flow
We calculate free cash flow as net cash provided by operating activities reduced by purchases of property and equipment. Management believes free cash flow is a useful measure of liquidity and an additional basis for assessing our ability to generate cash. There are limitations related to the use of free cash flow as an analytical tool, including: other companies may calculate free cash flow differently, which reduces its usefulness as a comparative measure; and free cash flow does not reflect our future contractual commitments nor does it represent the total residual cash flow for a given period.
The following table presents a reconciliation of free cash flow to net cash provided by operating activities, the most directly comparable financial measure prepared in accordance with GAAP:
| | | | | | | | | | | | | | | | | |
| Year Ended December 31, |
| 2021 | | 2020 | | 2019 |
Net cash provided by operating activities | $ | 23,968 | | | $ | 21,712 | | | $ | 511 | |
Less: purchases of property and equipment | (7,734) | | (1,328) | | (1,031) |
Free cash flow | $ | 16,234 | | $ | 20,384 | | $ | (520) |
Our free cash flow has fluctuated over time primarily as a result of timing of inventory purchases to support our rapid growth. While we have strong long-term relationships with our manufacturers, we usually pay for our inventory in advance. This supports our test and repeat buying model and helps with our ability to move new designs we receive from our suppliers into production and then into inventory in as few as 30-45 days. Our operating model requires a low level of capital expenditure.
Factors Affecting Our Performance
Brand Awareness
Our ability to promote our brands and maintain brand awareness and loyalty is critical to our success. We have a significant opportunity to continue to grow awareness and loyalty to our brands through word of mouth, brand marketing and performance marketing. We have leveraged performance marketing to deliver our growth. We plan to continue to invest in performance marketing and increase our investment in brand awareness across our brands to drive our future growth. Failure to successfully promote our brands and maintain brand awareness would have an adverse impact to our operating results.
Customer Acquisition
To continue to grow our business profitably, we intend to acquire new customers and retain our existing customers at a reasonable cost. Our methods to acquire customers have evolved in response to changes in shopping behaviors and costs to advertise, but we have continued the trend of efficiently and effectively acquiring customers as initially established by each of our brands prior to their acquisitions. Failure to continue attracting customers efficiently and profitably would adversely impact our profitability and operating results.
Customer Retention
Our results are driven not only by the ability of our brands to acquire customers, but also by their ability to retain customers and encourage repeat purchases. We monitor retention across our entire customer base. While we did not have control over all five brands until 2021, each of our brands have always aimed to attract and convert visitors into active customers and foster relationships that drive repeat purchases. Despite changes in customer shopping behaviors, impacted by the COVID-19 pandemic and other factors, we have maintained high rates of customer retention and repeat purchases.
Impact of COVID-19
With the onset of the COVID-19 pandemic, the ability to purchase through eCommerce channels became increasingly important to consumers, as many businesses, including brick-and-mortar retail stores, were ordered to close and people were required to stay at home. While demand for our products improved during this time period, the extent of this heightened demand remains uncertain. We believe the pandemic has accelerated the awareness of our brands and a shift in purchasing decisions that will continue to drive future growth. As in-store shopping begins to regain momentum across the world, the growing awareness of our brand and future sales growth may begin to slow.
Certain of our manufacturers experienced delays and shut-downs due to the COVID-19 pandemic, which caused delays on shipments of products. In order to manage the impact of these disruptions and meet our customers’ expectations, we increased our use of more expensive air freight during portions of 2020 and 2021, which increased our cost of goods sold. In addition, the ongoing impact of the pandemic is continuing to result in reduced cargo capacity on airplanes, and as a result we expect increased demand and prices for shipping services to continue. As a result, we expect to continue to make increased use of more expensive air freight, which will continue to result in increased cost of goods. While we have been able to offset increased shipping prices to some extent to date, there can be no assurance that we will continue to be able to do so, or that prices for shipping services will not increase to a level that does not permit us to do so. Other impacts of the pandemic on us have included, and in the future could include:
•volatility in demand for our products as a result of, among other things, the inability of customers to purchase our products due to financial hardship, unemployment, illness or fear of exposure to COVID-19, shifts in demand away from consumer discretionary products and reduced options for marketing and promotion of products or other restrictions in connection with the COVID-19 pandemic;
•cancellations of in-person events, including weddings and festivals, causing a reduction in demand for certain product categories;
•increased materials and procurement costs as a result of scarcity or increased prices of commodities and raw materials, and periods of reduced manufacturing capacity at our suppliers in response to the pandemic;
•increased sea and air freight shipping costs as a result of unprecedented levels of demand, reduced capacity, scrutiny or embargoing of goods produced in infected areas, port closures and other transportation challenges;
•closures or other restrictions that limit capacity at our distribution facilities and restrict our employees’ ability to perform necessary business functions, including operations necessary for the design, development, production, sale, marketing, delivery and support of our products; and
•failure of our suppliers and other third parties on which we rely to meet their obligations to us in a timely manner or at all, as a result of their own financial or operational difficulties, including business failure or insolvency, the inability to access financing in the credit and capital markets on satisfactory terms or at all, and inability to collect existing receivables.
All of these factors have contributed to, and we expect will continue to contribute to, reduced orders, increased product returns, increased order cancellations, lower revenues, higher discounts, increased inventories, decreased value of inventories, reduced sales through Culture Kings experiential stores and lower gross margins.
Foreign Currency Rate Fluctuations
Our international operations have provided and are expected to continue to provide a significant portion of our Company’s net sales and operating income. As a result, our Company’s net sales and operating income will continue to be affected by changes in the U.S. dollar against international currencies, but predominantly against the Australian dollar. In order to provide a framework for assessing the performance of our underlying business, excluding the effects of foreign currency rate fluctuations, we compare the percent change in the results from one period to another period in this Annual Report on Form 10-K using a constant currency methodology wherein current and comparative prior period results for our operations reporting in currencies other than U.S. dollars are converted into U.S. dollars at constant exchange rates (i.e., the rates in effect on December 31, 2020, which was the last day of our prior fiscal year) rather than the actual exchange rates in effect during the respective periods. Such disclosure throughout our management’s discussion and analysis of financial condition and results of operations will be described as “on a constant currency basis.” Volatility in currency exchange rates may impact the results, including net sales and operating income, of the Company in the future.
Results of Operations
The following tables set forth our results of operations for the periods presented and express the relationship of certain line items as a percentage of net sales for those periods. The period-to-period comparison of financial results is not necessarily indicative of future results.
| | | | | | | | | | | | | | | | | |
| Year Ended December 31, |
| In thousands | 2021 | | 2020 | | 2019 |
| Net sales | $ | 562,191 | | | $ | 215,916 | | | $ | 102,440 | |
| Cost of sales | 254,527 | | | 89,515 | | | 46,575 | |
| Gross profit | 307,664 | | | 126,401 | | | 55,865 | |
| Operating expenses: | | | | | |
| Selling | 144,345 | | | 58,313 | | | 28,091 | |
| Marketing | 58,120 | | | 17,871 | | | 7,666 | |
| General and administrative | 88,816 | | | 28,077 | | | 17,515 | |
| Total operating expenses | 291,281 | | | 104,261 | | | 53,272 | |
| Income from operations | 16,383 | | | 22,140 | | | 2,593 | |
| Other expense, net: | | | | | |
| Interest expense | (9,485) | | | (329) | | | (272) | |
| Loss on extinguishment of debt | (10,924) | | | — | | | — | |
| Other expense, net | (1,213) | | | (156) | | | 133 | |
Total other expense, net | (21,622) | | | (485) | | | (139) | |
| Income (loss) before income taxes | (5,239) | | | 21,655 | | | 2,454 | |
| Provision for income tax | (852) | | | (6,850) | | | (1,012) | |
| Net income (loss) | (6,091) | | | 14,805 | | | 1,442 | |
Net loss (income) attributable to noncontrolling interests | 123 | | | (471) | | | (48) | |
| Net income (loss) attributable to a.k.a. Brands Holding Corp. | $ | (5,968) | | | $ | 14,334 | | | $ | 1,394 | |
| | | | | | | | | | | | | | | | | |
| Year Ended December 31, |
| 2021 | | 2020 | | 2019 |
Net sales | 100 | % | | 100 | % | | 100 | % |
Cost of sales | 45 | % | | 41 | % | | 45 | % |
Gross profit | 55 | % | | 59 | % | | 55 | % |
Operating expenses: | | | | | |
Selling | 26 | % | | 27 | % | | 27 | % |
Marketing | 10 | % | | 8 | % | | 7 | % |
General and administrative | 16 | % | | 13 | % | | 17 | % |
Total operating expenses | 52 | % | | 48 | % | | 52 | % |
Income from operations | 3 | % | | 10 | % | | 3 | % |
| Other expense, net: | | | | | |
| Interest expense | (2 | %) | | —% | | —% |
| Loss on extinguishment of debt | (2 | %) | | —% | | —% |
| Other expense, net | — | % | | —% | | —% |
Total other expense, net | (4 | %) | | —% | | —% |
Income (loss) before income taxes | (1 | %) | | 10 | % | | 2 | % |
| Provision for income tax | — | % | | (3%) | | (1%) |
| Net income (loss) | (1 | %) | | 7 | % | | 1 | % |
Net loss (income) attributable to noncontrolling interests | — | % | | — | % | | — | % |
| Net income (loss) attributable to a.k.a. Brands Holding Corp. | (1 | %) | | 7 | % | | 1 | % |
Comparison of the Years Ended December 31, 2021 and 2020
Net Sales
| | | | | | | | | | | |
| Years Ended December 31, |
| 2021 | | 2020 |
Net sales | $ | 562,191 | | | $ | 215,916 | |
Net sales increased by $346.3 million, or 160%, in 2021 compared to 2020. The overall increase in net sales was primarily driven by a 126% increase in the number of orders we processed in 2021 compared to 2020, driving an increase in net sales of $339.0 million. Additionally, an increase in our average order value of 15%, from $75 in 2020 to $86 in 2021 also contributed $32.2 million to the overall increase in net sales. The increase in the number of orders was largely driven by the acquisition of Culture Kings on March 31, 2021 and growth of Princess Polly in the U.S. The increase in our average order value was primarily due to the implementation of targeted price increases at Princess Polly and Petal & Pup. On a constant currency basis, net sales and average order value for 2021 would have increased 154% and 13%, respectively. Net sales for 2021 include the operations of Culture Kings and mnml, or $208.0 million of net sales, from the date of their acquisitions, March 31, 2021 and October 14, 2021, respectively.
Cost of Sales
| | | | | | | | | | | |
| Years Ended December 31, |
| 2021 | | 2020 |
Cost of sales | $ | 254,527 | | | $ | 89,515 | |
Percent of net sales | 45 | % | | 41 | % |
Cost of sales increased by $165.0 million, or 184%, in 2021 compared to 2020. This increase was primarily driven by a 126% increase in the total number of orders in 2021, as compared to 2020, which includes the impact of the operations of Culture Kings and mnml, or $114.7 million of cost of sales, from the date of their acquisitions, March 31, 2021 and October 14, 2021, respectively. The increase in cost of sales as a percentage of net sales was primarily due to the $15.9 million impact from the fair value increase in inventory acquired in the Culture Kings and mnml acquisitions, which will disproportionately increase cost of sales until the inventory is completely sold through, and higher air freight expense. As of December 31, 2021, $0.7 million of impact from the fair value increase in inventory acquired in the mnml acquisition remains in inventory and will impact cost of sales in the first quarter of 2022.
Gross Profit
| | | | | | | | | | | |
| Years Ended December 31, |
| 2021 | | 2020 |
| Gross profit | $ | 307,664 | | | $ | 126,401 | |
| Gross margin | 55 | % | | 59 | % |
Gross profit increased by $181.3 million, or 143%, in 2021 compared to 2020. This increase was primarily driven by the significant increase in net sales. The decrease in gross margin was primarily due to the $15.9 million impact from the fair value increase in inventory acquired in the Culture Kings and mnml acquisitions, which disproportionately increases cost of sales until it is completely sold through, higher air freight expense and inclusion of Culture Kings, partially offset by the implementation of targeted price increases at Princess Polly and Petal & Pup. Culture Kings has a lower mix of exclusive products compared to our overall portfolio. Exclusive products have a higher gross margin compared to other products we sell.
Selling Expenses
| | | | | | | | | | | |
| Years Ended December 31, |
| 2021 | | 2020 |
Selling | $ | 144,345 | | | $ | 58,313 | |
Percent of net sales | 26 | % | | 27 | % |
Selling expenses increased by $86.0 million, or 148%, in 2021 compared to 2020. This increase was driven by the 126% increase in the number of orders shipped in 2021 compared to 2020, which includes the operations of Culture Kings and mnml, or $48.0 million of selling expenses, from the date of their acquisitions, March 31, 2021 and October 14, 2021, respectively. The decrease in selling expenses as a percentage of net sales was due to a higher percentage of Culture Kings’ sales from customers in Australia, where our products ship at a cheaper rate. Shipping to customers in the U.S., whether from Australia or from a facility in the U.S., is more expensive on average due to distance or shipping upgrades.
Marketing Expenses
| | | | | | | | | | | |
| Years Ended December 31, |
| 2021 | | 2020 |
Marketing | $ | 58,120 | | | $ | 17,871 | |
Percent of net sales | 10 | % | | 8 | % |
Marketing expenses increased by $40.2 million, or 225%, in 2021 compared to 2020. The increase in marketing expenses was driven by the inclusion of the operations of Culture Kings and mnml, or $23.6 million of marketing expenses, from the date of their acquisitions, March 31, 2021 and October 14, 2021, respectively, and increased marketing investment to acquire customers and retain existing customers to generate higher net sales. The increase in marketing expenses as a percentage of net sales was primarily due to Culture Kings’ higher rate of advertising spend as they tested new marketing opportunities, as well as incremental holiday advertising spend across our brands.
General and Administrative Expenses
| | | | | | | | | | | |
| Years Ended December 31, |
| 2021 | | 2020 |
| General and administrative | $ | 88,816 | | | $ | 28,077 | |
| Percent of net sales | 16 | % | | 13 | % |
General and administrative expenses increased by $60.7 million, or 216%, in 2021 compared to 2020. The increase was primarily driven by the inclusion of the operations of Culture Kings and mnml, or $20.3 million of general and administrative expenses, from the date of their acquisitions, March 31, 2021 and October 14, 2021, respectively. Additionally, there was a $15.4 million increase in salaries and related benefits and equity-based compensation expense related to increases in our headcount across functions to support business growth, $5.4 million in transaction costs and $5.3 million in additional professional service fees. Finally, increases in D&O insurance and depreciation contributed to the increase. The increase in general and administrative expenses as a percentage of net sales resulted primarily from additional salaries and related benefits and equity-based compensation expense from corporate hires as well as additional professional service fees.
Other expense, net
| | | | | | | | | | | |
| Years Ended December 31, |
| 2021 | | 2020 |
| Other expense, net: | | | |
| Interest expense | $ | (9,485) | | | $ | (329) | |
| Loss on extinguishment of debt | (10,924) | | | — | |
| Other expense | (1,213) | | | (156) | |
Total other expense, net | $ | (21,622) | | | $ | (485) | |
Percent of net sales | (4) | % | | — | % |
Other expense, net increased by $21.1 million in 2021 compared to 2020 primarily due to the loss on extinguishment of debt resulting from the early payment and termination of our previous term debt, revolver and senior secured notes, as well as an increase in interest expense related to the senior secured notes, prior to their repayment, and the new term loan.
Provision for income tax
| | | | | | | | | | | |
| Years Ended December 31, |
| 2021 | | 2020 |
| Provision for income tax | $ | (852) | | | $ | (6,850) | |
| Percent of net sales | — | % | | (3 | %) |
| Effective tax rate | 16 | % | | 32 | % |
Provision for income tax decreased by $6.0 million, or 88% in 2021 compared to 2020. This decrease was due to a reduction in our income before income taxes, which was driven primarily by the loss on extinguishment of debt resulting from the early payment and termination of our previous term debt, revolver and senior secured notes, as well as an increase in interest expense related to such debt prior to its repayment. The change in effective tax rate from 2020 is primarily due to the impact of permanent differences, the most significant of which was non-deductible stock-based compensation related to incentive units.
Comparison of the Years Ended December 31, 2020 and 2019
Net Sales
| | | | | | | | | | | |
| Years Ended December 31, |
| 2020 | | 2019 |
Net sales | $ | 215,916 | | | $ | 102,440 | |
Net sales increased by $113.5 million, or 111%, in 2020 compared to 2019. The overall increase in net sales was primarily driven by a 75% increase in the number of orders we processed in 2020 compared to 2019, driving an increase in net sales of $92.5 million, of which $0.7 million related to a slightly higher order frequency from our active customers. Additionally, an increase in our average order value of 21%, from $62 in 2019 to $75 in 2020 drove a $21.0 million increase in net sales. The increase in the number of orders was largely driven by the growth of Princess Polly in the U.S. which launched in late-2019, as well as the acquisition of Petal & Pup and Rebdolls. The higher order frequency from our active customers was due to increasing brand awareness and the impact of the COVID-19 pandemic driving customers to our website. The increase in our average order value was due to the implementation of targeted price increases. Fiscal 2020 includes a full year of operations of Petal & Pup and Rebdolls, or $26.6 million and $4.4 million of net sales, respectively, while 2019 includes $9.5 million and $0.1 million of net sales for Petal & Pup and Rebdolls from their dates of acquisition, August 2019 and December 2019, respectively.
Cost of Sales
| | | | | | | | | | | |
| Years Ended December 31, |
| 2020 | | 2019 |
Cost of sales | $ | 89,515 | | | $ | 46,575 | |
Percent of net sales | 41 | % | | 45 | % |
Cost of sales increased by $42.9 million, or 92%, in 2020 compared to 2019. This increase was primarily driven by a 75% increase in the total number of orders in 2020, as compared to 2019. The decrease in cost of sales as a percentage of net sales was due to the implementation of targeted price increases and a higher mix of exclusive offerings which have a higher gross margin rate than other items we sell. The targeted price increases drove a 21% increase in our average order value. Sales of exclusive offerings, as a percent of sales, grew by 5% primarily due to the focus on growing Princess Polly’s private label offerings. Fiscal 2020 includes a full year of operations of Petal & Pup and Rebdolls, or $10.3 million and $1.9 million of cost of sales, respectively, while 2019 includes $3.7 million and $0.1 million of cost of sales for Petal & Pup and Rebdolls from their dates of acquisition, August 2019 and December 2019, respectively.
Gross Profit
| | | | | | | | | | | |
| Years Ended December 31, |
| 2020 | | 2019 |
| Gross profit | $ | 126,401 | | | $ | 55,865 | |
| Gross margin | 59 | % | | 55 | % |
Gross profit increased by $70.5 million, or 126%, in 2020 compared to 2019. This increase was primarily driven by a significant increase in net sales and an improvement in our gross margin. The increase in gross margin was due to the implementation of targeted price increases and a higher mix of exclusive offerings which have a higher gross margin rate than other items we sell. The targeted price increases drove a 21% increase in our average order value. Sales of exclusive offerings, as a percent of sales, grew by 5% primarily due to the focus on growing Princess Polly’s private label offerings. Fiscal 2020 includes a full year of operations of Petal & Pup and Rebdolls, or $16.3 million and $2.4 million of gross profit, respectively, while 2019 only includes $5.8 million and no gross profit for Petal & Pup and Rebdolls from their dates of acquisition, August 2019 and December 2019, respectively.
Selling Expenses
| | | | | | | | | | | |
| Years Ended December 31, |
| 2020 | | 2019 |
Selling | $ | 58,313 | | | $ | 28,091 | |
Percent of net sales | 27 | % | | 27 | % |
Selling expenses increased by $30.2 million, or 108%, in 2020 compared to 2019. This increase was driven by the 75% increase in the number of orders shipped in 2020 compared to 2019. As a percentage of net sales, selling expenses were flat in 2020 compared to 2019. Fiscal 2020 includes a full year of operations of Petal & Pup and Rebdolls, or $6.6 million and $0.9 million of selling expenses, respectively, while 2019 only includes $2.3 million of selling expenses for Petal & Pup from its date of acquisition, August 2019. Rebdolls had an insignificant amount of selling expenses in 2019 as it was acquired in December 2019.
| | | | | | | | | | | |
| Years Ended December 31, |
| 2020 | | 2019 |
Marketing | $ | 17,871 | | | $ | 7,666 | |
Percent of net sales | 8 | % | | 7 | % |
Marketing expenses increased by $10.2 million, or 133%, in 2020 compared to 2019. The increase in marketing expenses in dollars and as a percentage of net sales was driven by increased marketing investment to acquire customers and retain existing customers to generate higher net sales, particularly in the U.S. where we spent more to grow awareness of our brands. Fiscal 2020 includes a full year of operations of Petal & Pup and Rebdolls, or $4.7 million and $0.6 million of marketing expenses, respectively, while 2019 only includes $1.3 million of marketing expenses for Petal & Pup from its date of acquisition, August 2019. Rebdolls had an insignificant amount of marketing expenses in 2019 as it was acquired in December 2019.
General and Administrative Expenses
| | | | | | | | | | | |
| Years Ended December 31, |
| 2020 | | 2019 |
| General and administrative | $ | 28,077 | | | $ | 17,515 | |
| Percent of net sales | 13 | % | | 17 | % |
General and administrative expenses increased by $10.6 million, or 60%, in 2020 compared to 2019. The increase was primarily driven by a $6.4 million increase in salaries and related benefits and equity-based compensation expense related to increases in our headcount across functions to support business growth. The decrease in general and administrative expenses as a percentage of net sales resulted primarily from an increase in efficiencies gained from our rapid sales growth in 2020. Fiscal 2020 includes a full year of operations of Petal & Pup and Rebdolls, or $2.6 million and $1.2 million of general and administrative expenses, respectively, while 2019 only includes $1.5 million and $0.1 million of general and administrative expenses for Petal & Pup and Rebdolls from their dates of acquisition, August 2019 and December 2019, respectively.
Other expense, net
| | | | | | | | | | | |
| Years Ended December 31, |
| 2020 | | 2019 |
Other expense, net | $ | (485) | | | $ | (139) | |
Percent of net sales | — | % | | — | % |
Provision for income tax
| | | | | | | | | | | |
| Years Ended December 31, |
| 2020 | | 2019 |
| Provision for income tax | $ | (6,850) | | | $ | (1,012) | |
| Percent of net sales | (3 | %) | | (1 | %) |
Provision for income tax increased by $5.8 million, or 577% in 2020 compared to 2019. This increase was driven by an increase in our income before income taxes.
Quarterly Results of Operations
The following tables set forth selected unaudited quarterly results of operations for the eight quarters ended December 31, 2021, as well as the percentage that each line item represents of net sales. The information for each of these quarters has been prepared on the same basis as the audited annual consolidated financial statements included elsewhere in this Annual Report on Form 10-K and in the opinion of management, includes all adjustments, which include only normal recurring adjustments, necessary for the fair statement of our consolidated results of operations for these periods. This data should be read in conjunction with our audited consolidated financial statements and related notes included elsewhere in this Annual Report on Form 10-K. Our quarterly results of operations will vary in the future. These quarterly operating results are not necessarily indicative of our operating results for any future period.
| | | | | | | | | | | | | | | | | | | | | | | | | | | | | | | | | | | | | | | | | | | | | | | |
| Three Months Ended |
| In thousands | Mar 31,
2020 | | Jun 30,
2020 | | Sep 30,
2020 | | Dec 31,
2020 | | Mar 31,
2021 | | Jun 30,
2021 | | Sep 30,
2021 | | Dec 31,
2021 |
| Net sales | $ | 35,006 | | | $ | 46,793 | | | $ | 63,336 | | | $ | 70,781 | | | $ | 68,779 | | | $ | 149,227 | | | $ | 161,762 | | | $ | 182,423 | |
| Cost of sales | 15,842 | | | 20,764 | | | 24,831 | | | 28,078 | | | 28,191 | | | 67,793 | | | 75,652 | | | 82,891 | |
| Gross profit | 19,164 | | | 26,029 | | | 38,505 | | | 42,703 | | | 40,588 | | | 81,434 | | | 86,110 | | | 99,532 | |
| Operating expenses: | | | | | | | | | | | | | | | |
| Selling | 10,620 | | | 13,408 | | | 15,707 | | | 18,577 | | | 18,254 | | | 40,023 | | | 40,582 | | | 45,486 | |
| Marketing | 4,079 | | | 3,158 | | | 4,602 | | | 6,032 | | | 6,224 | | | 14,908 | | | 15,463 | | | 21,525 | |
| General and administrative | 4,503 | | | 6,017 | | | 7,307 | | | 10,250 | | | 13,430 | | | 19,220 | | | 28,900 | | | 27,266 | |
| Total operating expenses | 19,202 | | | 22,583 | | | 27,616 | | | 34,859 | | | 37,908 | | | 74,151 | | | 84,945 | | | 94,277 | |
| Income (loss) from operations | (38) | | | 3,446 | | | 10,889 | | | 7,844 | | | 2,680 | | | 7,283 | | | 1,165 | | | 5,255 | |
| Total other expense, net | (56) | | | (114) | | | (220) | | | (96) | | | (123) | | | (4,155) | | | (15,589) | | | (1,755) | |
| Income (loss) before income taxes | (94) | | | 3,332 | | | 10,669 | | | 7,748 | | | 2,557 | | | 3,128 | | | (14,424) | | | 3,500 | |
| Provision for income tax | 30 | | | (1,054) | | | (3,375) | | | (2,451) | | | (767) | | | (939) | | | 4,331 | | | (3,477) | |
| Net income (loss) | (64) | | | 2,278 | | | 7,294 | | | 5,297 | | | 1,790 | | | 2,189 | | | (10,093) | | | 23 | |
Net income (loss) attributable to noncontrolling interests | 2 | | | (72) | | | (232) | | | (169) | | | (318) | | | 242 | | | 199 | | | — | |
| Net income (loss) attributable to a.k.a. Brands Holding Corp. | $ | (62) | | | $ | 2,206 | | | $ | 7,062 | | | $ | 5,128 | | | $ | 1,472 | | | $ | 2,431 | | | $ | (9,894) | | | $ | 23 | |
| | | | | | | | | | | | | | | | | | | | | | | | | | | | | | | | | | | | | | | | | | | | | | | |
| Three Months Ended |
| Mar 31,
2020 | | Jun 30,
2020 | | Sep 30,
2020 | | Dec 31,
2020 | | Mar 31,
2021 | | Jun 30,
2021 | | Sep 30,
2021 | | Dec 31,
2021 |
| Net sales | 100 | % | | 100 | % | | 100 | % | | 100 | % | | 100 | % | | 100 | % | | 100 | % | | 100 | % |
| Cost of sales | 45 | % | | 44 | % | | 39 | % | | 40 | % | | 41 | % | | 45 | % | | 47 | % | | 45 | % |
| Gross profit | 55 | % | | 56 | % | | 61 | % | | 60 | % | | 59 | % | | 55 | % | | 53 | % | | 55 | % |
| Operating expenses: | | | | | | | | | | | | | | | |
| Selling | 30 | % | | 29 | % | | 25% | | 26% | | 27% | | 27% | | 25% | | 25% |
| Marketing | 12 | % | | 7 | % | | 7% | | 9% | | 9% | | 10% | | 10% | | 12% |
| General and administrative | 13 | % | | 13 | % | | 12% | | 14% | | 20% | | 13% | | 18% | | 15% |
| Total operating expenses | 55 | % | | 48 | % | | 44% | | 49% | | 55% | | 50% | | 53% | | 52% |
| Income (loss) from operations | — | % | | 7 | % | | 17 | % | | 11 | % | | 4 | % | | 5 | % | | 1 | % | | 3 | % |
| Total other expense, net | —% | | —% | | —% | | —% | | —% | | (3%) | | (10%) | | (1%) |
| Income (loss) before income taxes | — | % | | 7 | % | | 17 | % | | 11 | % | | 4 | % | | 2 | % | | (9 | %) | | 2 | % |
| Provision for income tax | —% | | (2%) | | (5%) | | (3%) | | (1%) | | (1%) | | 3% | | (2%) |
| Net income (loss) | — | % | | 5 | % | | 12 | % | | 7 | % | | 3 | % | | 1 | % | | (6 | %) | | — | % |
Net income (loss) attributable to noncontrolling interests | — | % | | — | % | | — | % | | — | % | | — | % | | — | % | | — | % | | — | % |
| Net income (loss) attributable to a.k.a. Brands Holding Corp. | — | % | | 5 | % | | 11 | % | | 7 | % | | 2 | % | | 2 | % | | (6 | %) | | — | % |
Quarterly Trends and Seasonality
Net Sales, Cost of Sales and Gross Profit
Net sales have generally increased sequentially quarter-to-quarter as we have made acquisitions (Culture Kings on March 31, 2021 and mnml on October 14, 2021) and launched our brands in the U.S. (Princess Polly, Petal & Pup and Culture Kings), all while successfully gaining and retaining customers.
Our quarterly cost of sales and gross profit have fluctuated quarter-to-quarter primarily due to the quarterly fluctuations in net sales, targeted price increases in late 2020 and the impact from the amortization of the fair value increases in inventory acquired in the Culture Kings and mnml acquisitions.
Operating Expenses
Selling expenses have generally increased sequentially quarter-to-quarter primarily due to an increase in shipping and fulfillment costs to support the increase in number of orders, as well as increased labor rates in fulfillment.
Marketing expenses have generally increased sequentially quarter-to-quarter as we have continued to scale our marketing efforts together with the growth of our business.
General and administrative expenses have generally increased sequentially quarter-to-quarter as we have continued to increase our headcount to support business growth. In the third quarter of 2021, there were certain one-time stock-based compensation expenses related to the IPO.
Seasonality
We typically achieve our largest quarterly sales in the fourth fiscal quarter. In fiscal year 2020, our net sales in the first, second, third and fourth quarters represented 16%, 22%, 29% and 33%, respectively, of our total net sales for the year. In fiscal year 2021, our net sales in the first, second, third and fourth quarters represented 12%, 27%, 29% and 32%, respectively of our total net sales for the year. Sales are typically higher during the months of November and December driven by higher holiday season spending.
Quarterly Adjusted EBITDA and Adjusted EBITDA Margin
The following table sets forth a reconciliation of net income (loss) to adjusted EBITDA for the eight fiscal quarters ended December 31, 2021:
| | | | | | | | | | | | | | | | | | | | | | | | | | | | | | | | | | | | | | | | | | | | | | | |
| Three Months Ended |
| In thousands | Mar 31,
2020 | | Jun 30,
2020 | | Sep 30,
2020 | | Dec 31,
2020 | | Mar 31,
2021 | | Jun 30,
2021 | | Sep 30,
2021 | | Dec 31,
2021 |
| Net income (loss) | $ | (64) | | | $ | 2,278 | | | $ | 7,294 | | | $ | 5,297 | | | $ | 1,790 | | | $ | 2,189 | | | $ | (10,093) | | | $ | 23 | |
| Add (deduct): | | | | | | | | | | | | | | | |
| Total other expense, net | 56 | | | 114 | | | 220 | | | 96 | | | 123 | | | 4,155 | | | 15,589 | | | 1,755 | |
| Provision for (benefit from) income tax | (30) | | | 1,054 | | | 3,375 | | | 2,451 | | | 767 | | | 939 | | | (4,331) | | | 3,477 | |
| Depreciation and amortization expense | 1,449 | | | 1,654 | | | 1,697 | | | 1,962 | | | 2,566 | | | 4,535 | | | 4,235 | | | 5,374 | |
| Inventory step-up amortization expense | — | | | — | | | — | | | — | | | — | | | 6,266 | | | 5,985 | | | 3,657 | |
| Equity-based compensation expense | 122 | | | 297 | | | 418 | | | 542 | | | 523 | | | 609 | | | 5,582 | | | 1,329 | |
| Transaction costs | — | | | — | | | — | | | — | | | 2,557 | | | 736 | | | 1,580 | | | 514 | |
| Adjusted EBITDA | $ | 1,533 | | | $ | 5,397 | | | $ | 13,004 | | | $ | 10,348 | | | $ | 8,326 | | | $ | 19,429 | | | $ | 18,547 | | | $ | 16,129 | |
| Net income (loss) margin | — | % | | 5 | % | | 12 | % | | 7 | % | | 3 | % | | 1 | % | | (6) | % | | — | % |
| Adjusted EBITDA margin | 4 | % | | 12 | % | | 21 | % | | 15 | % | | 12 | % | | 13 | % | | 11 | % | | 9 | % |
Liquidity and Capital Resources
Since our inception through September 2021, we have financed our operations and capital expenditures primarily through cash flows generated by operations, private sales of equity securities or the incurrence of debt.
In September 2021, we completed an initial public offering (the “IPO”), in which we issued and sold 10,000,000 shares of newly authorized common stock for $11.00 per share for net proceeds of $95.7 million, after deducting underwriting discounts and commissions of $6.6 million, and offering costs of $7.7 million.
As of December 31, 2021, our principal sources of liquidity were cash and cash equivalents totaling $38.8 million. Our cash equivalents primarily consist of money market funds.
As of December 31, 2021, most of our cash was held for working capital purposes. We believe that our existing cash, together with cash generated from ongoing operations and available borrowing capacity under our line of credit, will be sufficient to meet our anticipated cash needs for the next 12 months. We believe that cash generated from ongoing operations and continued access to debt markets will be sufficient to satisfy our cash requirements beyond 12 months. However, our liquidity assumptions may prove to be incorrect, and we could exhaust our available financial resources sooner than we currently expect. We may seek to borrow funds under our line of credit or raise additional funds at any time through equity, equity-linked or debt financing arrangements. Our future capital requirements and the adequacy of available funds will depend on many factors, including those described in the section of this Annual Report on Form 10-K captioned “Risk Factors.” We may not be able to secure additional financing to meet our operating requirements on acceptable terms, or at all. The inability to raise capital if needed would adversely affect our ability to achieve our business objectives.
Senior Secured Credit Facilities
On March 31, 2021, we entered into senior secured credit facilities with syndicated lenders and an affiliate of Fortress Credit Corp as administrative agent that provided us with up to $25.0 million aggregate principal in revolver borrowings and a $125 million senior secured term loan facility (the “Fortress credit facilities”) that we used in financing our acquisition of Culture Kings. The $125 million senior term loan required us to make amortized quarterly payments equal to 0.75% of the original principal amounts, for an annual aggregate amount of 3.0%. Borrowings under the credit agreement accrued interest, at the option of the borrower, at an adjusted LIBOR plus 7.5% or ABR plus 6.5%, subject to adjustment based on achieving certain total net secured leverage ratios.
In connection with the IPO, we entered into a new senior secured credit facility inclusive of a $100 million term loan and a $50 million revolving line of credit, with an option of up to $50 million in additional term loan through an accordion provision. We used borrowings under this new credit facility, together with a portion of the proceeds from the IPO, to repay the Fortress credit facilities in full. The $100 million term loan requires us to make amortized annual payments of 5.0% during the first and second years, 7.5% during the third and fourth years and 10.0% during the fifth year with the balance of the loan due at maturity. Borrowings under the term loan accrue interest at a benchmark rate plus an applicable margin dependent upon our net leverage ratio. The $50 million revolving line of credit accrues interest at a benchmark rate plus an applicable margin dependent upon our net leverage ratio. The highest interest rates under the agreement for both the term loan and revolving line of credit occur at a net leverage ratio of greater than 2.75x, yielding an interest rate of a benchmark rate plus 3.25%. The accordion provision allows us to borrow additional amounts of term loan at terms to be agreed upon at the time of issuance, but on substantially the same basis as the original term loan. Principal payments of our term loan and accordion for the year ending December 31, 2022 are anticipated to total $5.6 million.
As part of our entering into the new senior secured credit facilities, we are subject to certain financial covenant ratios beginning with the fiscal quarter ended December 31, 2021, and certain annual mandatory prepayment terms based on excess cash flows, as defined by the credit agreement, based on our net leverage ratio for years beginning with the fiscal year ending December 31, 2022. If we are unable to comply with certain financial covenant ratios and terms requiring mandatory prepayment based on a percentage of excess cash flows, our long-term liquidity position may be adversely impacted. Furthermore, the variable interest rates associated with our new senior secured credit facilities could result in interest payments that are higher than anticipated.
Refer to Note 8 to our consolidated financial statements included elsewhere in this Annual Report on Form 10-K for additional information regarding our senior secured credit facilities.
Lines of Credit
On November 6, 2018, we entered into a line of credit with Commonwealth Bank of Australia in the amount of $7 million under the subsidiary Princess Polly Bidco Pty. The line of credit was amended on August 1, 2019 to increase the facility amount to $15.6 million. Borrowings under the credit agreement accrued an interest rate of AU Screen Rate (ASX) + 3.25% per annum. Obligations under the credit agreement were secured by cash, inventory and other liquid assets. As of December 31, 2020, the amount outstanding was $6.2 million. The facility was repaid in full and terminated as of February 28, 2021.
On December 31, 2019, we entered into a line of credit with Bank of America in the amount of $0.5 million under the subsidiary Rebdoll, Inc. The line of credit was guaranteed by Excelerate, L.P. Borrowings under the credit agreement accrued an interest rate of LIBOR + 2.25%. As of December 31, 2020, the amount outstanding was $0.2 million. The outstanding borrowings were repaid in full and the line of credit was terminated as of February 28, 2021.
On October 25, 2019, we entered into a line of credit with Moneytech in the amount of $2.8 million under the subsidiary Petal & Pup Pty Ltd. Borrowings under the credit agreement accrued an interest rate of 7.27%. The line of credit was terminated in February 2021.
Material Cash Requirements
Our material cash requirements include operating lease obligations and inventory purchase commitments.
We have lease arrangements for certain equipment and facilities, primarily office locations, warehouse facilities and retail stores. Most of our property, equipment and software have been purchased with cash. One newly executed lease for a new Culture Kings store in Las Vegas will be material to our operations with a first year annual cash payment of approximately $1.7 million, paid in monthly installments beginning in November 2022, that increase by 3.0% each year through the tenth anniversary of the lease commencement. As of December 31, 2021, our future minimum payments under non-cancelable operating leases totaled $30.7 million, with $6.7 million payable within 12 months.
While we routinely contract for the purchase of inventory from vendors, we have no material long-term purchase obligations outstanding with any vendors or third parties. As of December 31, 2021, inventory and other purchase obligations payable within the next 12 months totaled $9.2 million, which primarily represent open purchase orders for materials and merchandise as of that date.
Additionally, we plan to incur capital expenditures of approximately $18.0 to $20.0 million in 2022. This reflects the opening of the new Culture Kings store in Las Vegas in addition to investments in infrastructure and technology.
Historical Cash Flows
| | | | | | | | | | | | | | | | | |
| Year Ended December 31, |
| 2021 | | 2020 | | 2019 |
Net cash provided by operating activities | $ | 23,968 | | | $ | 21,712 | | | $ | 511 | |
Net cash used in investing activities | (278,075) | | (2,379) | | (21,828) |
Net cash provided by financing activities | 269,850 | | 1,240 | | 20,583 |
Net Cash Provided by Operating Activities
Cash from operating activities consists primarily of net income adjusted for certain non-cash items, including depreciation, amortization, equity-based compensation, the effect of changes in working capital and other activities.
In 2021, net cash provided by operating activities increased $2.3 million. This was attributable primarily to an increase in net income after adjusting for non-cash items. These increases were partially offset by an increase in inventory to support our growth and expansion in both the U.S. and Australia markets.
In 2020, net cash provided by operating activities increased $21.2 million. This was attributable to a $13.4 million increase in net income, a $5.7 million decrease in cash used for inventory and a $2.7 million decrease in cash used for prepaid expenses when compared to the prior year. The decrease in cash used for inventory and prepaid expenses from 2019 to 2020 was due to the launch of the Princess Polly brand in the U.S. in 2019, requiring buildup of inventory and securing warehouse space.
Net Cash Used in Investing Activities
Our primary investing activities have consisted of acquisitions to support our overall business growth and investments in our fulfillment centers and our internally developed software to support our infrastructure. Purchases of property and equipment may vary from period to period due to timing of the expansion of our operations.
In 2021, net cash used in investing activities increased $275.7 million. This was attributable to the acquisition of Culture Kings in March 2021, the purchase of the Petal & Pup noncontrolling interest in September 2021 and the acquisition of mnml in October 2021.
In 2020, net cash used in investing activities decreased $19.4 million. This was attributable to the decrease in cash used to acquire businesses, as in 2019, a.k.a. acquired a controlling interest in Petal & Pup.
Net Cash Provided by Financing Activities
Our financing activities have historically consisted of cash proceeds received from the issuance of borrowings, cash used to pay down borrowings or cash received in exchange for partner units, and more recently, the sale of our common stock in the IPO.
In 2021, net cash provided by financing activities increased $268.6 million. This was primarily attributable to the proceeds received from debt issuances and the IPO, as well as proceeds from the issuance of partner units to acquire Culture Kings in March 2021. These proceeds were partially offset by repayments of certain borrowings and, specifically related to the IPO, underwriters’ discounts and commissions.
In 2020, net cash provided by financing activities decreased $19.3 million. This was attributable to a decrease of $21.7 million in proceeds from the issuance of partner units to fund the acquisition of Petal & Pup, partially offset by a $2.4 million increase in cash used to repay lines of credit.
Critical Accounting Estimates
We believe that the following accounting estimates involve a high degree of judgment and complexity. Refer to Note 2 to our consolidated financial statements as of and for the years ended December 31, 2021, 2020 and 2019, included elsewhere in this Annual Report on Form 10-K for a description of our significant accounting policies. The preparation of our financial statements in conformity with GAAP requires us to make estimates and judgments that affect the amounts reported in those financial statements and accompanying notes. Although we believe that the estimates we use are reasonable, due to the inherent uncertainty involved in making those estimates, actual results reported in future periods could differ from those estimates.
Revenue Recognition
Our primary source of revenues is from sales of fashion apparel primarily through our digital platforms and stores. We determine revenue recognition through the following steps in accordance with Topic 606:
•identification of the contract, or contracts, with a customer;
•identification of the performance obligations in the contract;
•determination of the transaction price;
•allocation of the transaction price to the performance obligations in the contract; and
•recognition of revenue when, or as, we satisfy a performance obligation.
Revenue is recognized upon shipment when control of the promised goods or services is transferred to our customers, in an amount that reflects the consideration we expect to be entitled to in exchange for those goods or services. Our revenue is reported net of sales returns and discounts. We estimate our liability for product returns based on historical return trends and an evaluation of current economic and market conditions, all of which have a degree of uncertainty. We record the expected customer refund liability as a reduction to revenue, and the expected inventory right of recovery as a reduction of cost of goods sold. If actual return costs differ from previous estimates, the amount of the liability and corresponding revenue are adjusted in the period in which such costs occur. We have not made any material changes to our assumptions included in our calculations of expected customer refund activity during the year ended December 31, 2021.
Inventory
Inventories are stated at the lower of cost and net realizable value. Cost is determined using an average cost method. Cost of inventory includes import duties and other taxes and transport and handling costs to deliver the inventory to our distribution centers or stores. We write down inventory where it appears that the carrying cost of the inventory may not be recovered through subsequent sale of the inventory. We analyze the quantity of inventory on hand, the quantity sold in the past year, the anticipated sales volume, the expected sales price and the cost of making the sale when evaluating the value of our inventory. If the sales volume or sales price of specific products declines, additional write-downs may be required. We have not made any material changes to our assumptions included in the calculations of the lower of cost or net realizable value reserves during the year ended December 31, 2021.
Goodwill and Impairment of Intangible Assets
Goodwill represents the excess of the purchase price over the fair value of net assets, including the amount assigned to identifiable intangible assets. The primary drivers that generate goodwill are the value of synergies between the acquired entities and the Company and the acquired assembled workforce, neither of which qualifies as a separately identifiable intangible asset.
Goodwill is tested for impairment at least annually, in the fourth quarter and whenever changes in circumstances indicate an impairment may exist. The goodwill impairment test is performed at the reporting unit level, which is generally at the level of or one level below an operating segment. Generally, a qualitative assessment is first performed to determine whether a quantitative goodwill impairment test is necessary. If management determines, after performing an assessment based on the qualitative factors, that the fair value of the reporting unit is more likely than not less than the carrying amount, or that a fair value of the reporting unit substantially in the excess of the carrying amount cannot be assured, then a quantitative goodwill impairment test would be required. The quantitative test for goodwill impairment is performed by determining the fair value of the related reporting units. Fair value is measured based on the discounted cash flow method and relative market-based approaches. An impairment charge is recorded equal to any shortfall between the fair value of a reporting unit and its carrying value.
The carrying value of definite-lived intangible assets is reviewed whenever events or changes in circumstances indicate the carrying amount of the assets might not be recoverable. Factors that would necessitate an impairment assessment include a significant adverse change in the extent or manner in which an asset is used, a significant adverse change in legal factors or the business climate that could affect the value of the asset or a significant decline in the observable market value of an asset, among others. If such facts indicate a potential impairment, the Company would assess the recoverability of an asset group by determining if the carrying value of the asset group exceeds the sum of the projected undiscounted cash flows expected to result from the use and eventual disposition of the assets over the remaining economic life of the primary asset in the asset group. If the recoverability test indicates the carrying value of the asset group is not recoverable, the Company will estimate the fair value of the asset group using the discounted cash flow method. Any impairment would be measured as the difference between the asset group's carrying amount and its estimated fair value.
Significant judgment and estimates are required in assessing impairment of goodwill and intangible assets, including identifying whether events or changes in circumstances require an impairment assessment, estimating future cash flows and determining appropriate discount rates. Our estimates of fair value are based on assumptions believed to be reasonable, but which are inherently uncertain and unpredictable and, as a result, actual results may differ from estimates. No goodwill or intangible asset impairment was recorded for the years ended December 31, 2021 and 2020.
Income Taxes
Income taxes are accounted for under the asset and liability method. Deferred tax assets and liabilities are recognized for the future tax consequences attributable to differences between the financial statement carrying amounts of existing assets and liabilities and their respective tax bases and are recorded net on the face of the balance sheet. Deferred tax assets and liabilities are measured using enacted tax rates expected to apply to taxable income in the years in which those temporary differences are expected to be recovered or settled. The effect on deferred tax assets and liabilities of a change in tax rates is recognized in income in the period that includes the enactment date. We recognize the effect of income tax positions only if those positions are more likely than not of being sustained. Recognized income tax positions are measured at the largest amount that is greater than 50% likely of being realized. This assessment involves uncertainty and judgment. Changes in recognition or measurement are reflected in the period in which the change in judgment occurs. We have not made any material changes to our assumptions and estimates related to our income tax positions during the year ended December 31, 2021.
ITEM 7A. QUANTITATIVE AND QUALITATIVE DISCLOSURES ABOUT MARKET RISK
We have operations within the United States and internationally, and we are exposed to market risks in the ordinary course of our business, including the effects of foreign currency fluctuations, interest rate changes and inflation. Information relating to quantitative and qualitative disclosures about these market risks is set forth below.
Interest Rate Sensitivity
Cash and cash equivalents were held primarily in cash deposits and money market funds. The fair value of our cash and cash equivalents would not be significantly affected by either an increase or decrease in interest rates due mainly to the short-term nature of these instruments. Interest on any line of credit borrowings incurred pursuant to the credit described above would accrue at a floating rate based on a formula tied to certain market rates at the time of incurrence; however, we do not expect that any change in prevailing interest rates will have a material impact on our results of operations. As of December 31, 2021, we had approximately $110.8 million in debt outstanding under our term loan. Based on the levels of borrowings under our new senior secured credit facility at December 31, 2021, a hypothetical 100 basis point increase or decrease in underlying interest rates would increase or decrease interest expense by approximately $1.0 million. This hypothetical analysis may differ from the actual change in interest expense due to potential changes in interest rates or gross borrowings outstanding under our credit facilities. We do not utilize derivative financial instruments to manage our interest rate risks.
Foreign Currency Risk
We are exposed to fluctuations in currency exchange rates as a result of our operations in countries other than the U.S., principally related to our significant operations in Australia. As of December 31, 2021, movements in currency exchange rates and the related impact on the translation of the balance sheets resulted in the $27.6 million net loss in the currency translation category of accumulated other comprehensive income (loss). A hypothetical 10% increase or decrease in the Australian dollar exchange rate could result in a $46.4 million foreign currency translation fluctuation, which would be recorded in accumulated other comprehensive loss in the condensed consolidated balance sheets.
Additionally, a portion of our sales and costs are earned and incurred, respectively, in USD for subsidiaries that use AUD as their functional currency. These sales and costs generate foreign currency exposure. Furthermore, we have various assets and liabilities, primarily cash and intercompany receivables and payables, denominated in USD where the functional currency is AUD. These balance sheet items are subject to remeasurement which may create fluctuations in other expense within our consolidated results of operations. For the year ended December 31, 2021, movements in currency exchange rates resulted in $0.9 million net loss in other expense.
Inflation
Currently, we do not believe that inflation has had a material effect on our business, financial condition or results of operations. We continue to monitor the impact of inflation to minimize its effects through sourcing and pricing strategies, productivity improvements and cost reductions. If our costs were to become subject to significant inflationary pressures, we may not be able to fully offset such higher costs through price increases. Our inability or failure to do so could harm our business, financial condition and results of operations.
ITEM 8. CONSOLIDATED FINANCIAL STATEMENTS AND SUPPLEMENTARY DATA
a.k.a. BRANDS HOLDING CORP.
INDEX TO CONSOLIDATED FINANCIAL STATEMENTS
REPORT OF INDEPENDENT REGISTERED PUBLIC ACCOUNTING FIRM
To the Board of Directors and Stockholders of a.k.a. Brands Holding Corp.
Opinion on the Financial Statements
We have audited the accompanying consolidated balance sheets of a.k.a. Brands Holding Corp. and its subsidiaries (the “Company”) as of December 31, 2021 and 2020, and the related consolidated statements of income, comprehensive income, changes in stockholders’ equity, partners’ capital and redeemable noncontrolling interest and cash flows for each of the three years in the period ended December 31, 2021, including the related notes (collectively referred to as the “consolidated financial statements”). In our opinion, the consolidated financial statements present fairly, in all material respects, the financial position of the Company as of December 31, 2021 and 2020, and the results of its operations and its cash flows for each of the three years in the period ended December 31, 2021 in conformity with accounting principles generally accepted in the United States of America.
Basis for Opinion
These consolidated financial statements are the responsibility of the Company’s management. Our responsibility is to express an opinion on the Company’s consolidated financial statements based on our audits. We are a public accounting firm registered with the Public Company Accounting Oversight Board (United States) (PCAOB) and are required to be independent with respect to the Company in accordance with the U.S. federal securities laws and the applicable rules and regulations of the Securities and Exchange Commission and the PCAOB.
We conducted our audits of these consolidated financial statements in accordance with the standards of the PCAOB. Those standards require that we plan and perform the audit to obtain reasonable assurance about whether the consolidated financial statements are free of material misstatement, whether due to error or fraud. The Company is not required to have, nor were we engaged to perform, an audit of its internal control over financial reporting. As part of our audits we are required to obtain an understanding of internal control over financial reporting but not for the purpose of expressing an opinion on the effectiveness of the Company's internal control over financial reporting. Accordingly, we express no such opinion.
Our audits included performing procedures to assess the risks of material misstatement of the consolidated financial statements, whether due to error or fraud, and performing procedures that respond to those risks. Such procedures included examining, on a test basis, evidence regarding the amounts and disclosures in the consolidated financial statements. Our audits also included evaluating the accounting principles used and significant estimates made by management, as well as evaluating the overall presentation of the consolidated financial statements. We believe that our audits provide a reasonable basis for our opinion.
/s/ PricewaterhouseCoopers
Melbourne, Australia
March 1, 2022
We have served as the Company’s auditor since 2021.
a.k.a. BRANDS HOLDING CORP.
CONSOLIDATED BALANCE SHEETS
(in thousands, except share and per share amounts)
| | | | | | | | | | | |
| December 31, |
| 2021 | | 2020 |
| Assets | | | |
Current assets: | | | |
Cash and cash equivalents | $ | 38,832 | | | $ | 26,259 | |
Restricted cash | 2,186 | | | 840 | |
Accounts receivable | 2,663 | | | 1,183 | |
Inventory, net | 115,783 | | | 33,124 | |
| Prepaid income taxes | 4,059 | | | — | |
Prepaid expenses and other current assets | 20,809 | | | 4,080 | |
Total current assets | 184,332 | | | 65,486 | |
Property and equipment, net | 14,657 | | | 2,121 | |
Operating lease right-of-use assets | 26,415 | | | 4,477 | |
Intangible assets, net | 98,287 | | | 29,102 | |
Goodwill | 363,305 | | | 88,253 | |
| Other assets | 850 | | | — | |
Total assets | $ | 687,846 | | | $ | 189,439 | |
Liabilities, stockholders’ equity and partners’ capital | | | |
Current liabilities: | | | |
Accounts payable | $ | 25,088 | | | $ | 4,689 | |
Accrued liabilities | 53,375 | | | 18,169 | |
Sales returns reserve | 6,887 | | | 3,517 | |
Deferred revenue | 11,344 | | | 4,165 | |
| Income taxes payable | — | | | 3,118 | |
Operating lease liabilities, current | 5,721 | | | 1,234 | |
Current portion of long-term debt | 5,600 | | | 6,353 | |
Total current liabilities | 108,015 | | | 41,245 | |
Long-term debt | 103,182 | | | — | |
Operating lease liabilities | 21,370 | | | 3,262 | |
Other long-term liabilities | 1,333 | | | 144 | |
Deferred income taxes, net | 2,920 | | | 5,904 | |
Total liabilities | 236,820 | | | 50,555 | |
| Commitments and contingencies (Note 15) | | | |
Stockholders’ equity and partners’ capital: | | | |
Preferred stock, $0.001 par value; 50,000,000 and zero shares authorized; zero shares issued or outstanding | — | | | — | |
Common stock, $0.001 par value; 500,000,000 and zero shares authorized; 128,647,836 and zero shares issued and outstanding | 129 | | | — | |
Partnership units (1) | — | | | 108,197 | |
Additional paid-in capital | 453,807 | | | 727 | |
Accumulated other comprehensive income (loss) | (11,080) | | | 5,839 | |
Retained earnings | 8,170 | | | 14,138 | |
Noncontrolling interest | — | | | 9,983 | |
Total stockholders’ equity and partners’ capital | 451,026 | | | 138,884 | |
Total liabilities, stockholders’ equity and partners’ capital | $ | 687,846 | | | $ | 189,439 | |
_________________
(1)Excelerate, L.P. was the predecessor entity to a.k.a. Brands Holding Corp. Refer to Note 1 for additional information.
The accompanying notes are an integral part of these consolidated financial statements
a.k.a. BRANDS HOLDING CORP.
CONSOLIDATED STATEMENTS OF INCOME
(in thousands, except share and per share data)
| | | | | | | | | | | | | | | | | |
| Year Ended December 31, |
| 2021 | | 2020 | | 2019 |
Net sales | $ | 562,191 | | | $ | 215,916 | | | $ | 102,440 | |
Cost of sales | 254,527 | | | 89,515 | | | 46,575 | |
Gross profit | 307,664 | | | 126,401 | | | 55,865 | |
Operating expenses: | | | | | |
Selling | 144,345 | | | 58,313 | | | 28,091 | |
Marketing | 58,120 | | | 17,871 | | | 7,666 | |
General and administrative | 88,816 | | | 28,077 | | | 17,515 | |
Total operating expenses | 291,281 | | | 104,261 | | | 53,272 | |
Income from operations | 16,383 | | | 22,140 | | | 2,593 | |
| Other expense, net: | | | | | |
| Interest expense | (9,485) | | | (329) | | | (272) | |
| Loss on extinguishment of debt | (10,924) | | | — | | | — | |
| Other expense | (1,213) | | | (156) | | | 133 | |
| Total other expense, net | (21,622) | | | (485) | | | (139) | |
Income (loss) before income taxes | (5,239) | | | 21,655 | | | 2,454 | |
Provision for income tax | (852) | | | (6,850) | | | (1,012) | |
Net income (loss) | (6,091) | | | 14,805 | | | 1,442 | |
Net loss (income) attributable to noncontrolling interests | 123 | | | (471) | | | (48) | |
Net income (loss) attributable to a.k.a. Brands Holding Corp. | $ | (5,968) | | | $ | 14,334 | | | $ | 1,394 | |
Net income (loss) per share: | | | | | |
Basic | $ | (0.06) | | | $ | 0.21 | | | $ | 0.02 | |
Diluted | $ | (0.06) | | | $ | 0.21 | | | $ | 0.02 | |
Weighted average shares outstanding: | | | | | |
Basic | 93,231,377 | | | 69,846,362 | | | 61,988,641 | |
Diluted | 93,231,377 | | | 69,846,362 | | | 61,988,641 | |
The accompanying notes are an integral part of these consolidated financial statements
a.k.a. BRANDS HOLDING CORP.
CONSOLIDATED STATEMENTS OF COMPREHENSIVE INCOME
(in thousands)
| | | | | | | | | | | | | | | | | |
| Year Ended December 31, |
| 2021 | | 2020 | | 2019 |
Net income (loss) | $ | (6,091) | | | $ | 14,805 | | | $ | 1,442 | |
Other comprehensive income (loss): | | | | | |
Currency translation | (27,619) | | | 11,355 | | | 244 | |
Total comprehensive income (loss) | (33,710) | | | 26,160 | | | 1,686 | |
Comprehensive loss (income) attributable to noncontrolling interests | 10,824 | | | (1,256) | | | (413) | |
| Comprehensive income (loss) attributable to a.k.a. Brands Holding Corp. | $ | (22,886) | | | $ | 24,904 | | | $ | 1,273 | |
The accompanying notes are an integral part of these consolidated financial statements
a.k.a. BRANDS HOLDING CORP.
CONSOLIDATED STATEMENTS OF STOCKHOLDERS’ EQUITY, PARTNERS’ CAPITAL(1) AND REDEEMABLE NONCONTROLLING INTEREST
(in thousands, except share and unit data)
| | | | | | | | | | | | | | | | | | | | | | | | | | | | | | | | | | | | | | | | | | | | | | | | | | | | | | | | | | | | | | |
| Common Stock | | Partnership Units | | Additional Paid-In Capital |
| Accumulated Other Comprehensive Income (Loss) | | Retained Earnings (Accumulated Deficit) | | Non-controlling Interest | | Total Equity | | | Redeemable Noncontrolling Interest |
| Shares | | Amount | | Units | | Amount | | | | | | | |
Balance as of December 31, 2018 | — | | | $ | — | | | 93,362,500 | | | $ | 85,583 | | | $ | 141 | | | $ | (4,610) | | | $ | (1,590) | | | $ | — | | | $ | 79,524 | | | | $ | — | |
| Issuance of units | — | | | — | | | 20,398,838 | | | 22,164 | | | — | | | — | | | — | | | — | | | 22,164 | | | | — | |
| Equity-based compensation | — | | | — | | | — | | | — | | | 353 | | | — | | | — | | | — | | | 353 | | | | — | |
| Cumulative translation adjustment | — | | | — | | | — | | | — | | | — | | | (121) | | | — | | | 365 | | | 244 | | | | — | |
| Noncontrolling interest from acquisition | — | | | — | | | — | | | — | | | — | | | — | | | — | | | 8,314 | | | 8,314 | | | | — | |
| Net income | — | | | — | | | — | | | — | | | — | | | — | | | 1,394 | | | 48 | | | 1,442 | | | | — | |
| Balance as of December 31, 2019 | — | | | — | | | 113,761,338 | | | 107,747 | | | 494 | | | (4,731) | | | (196) | | | 8,727 | | | 112,041 | | | | — | |
| Issuance of units | — | | | — | | | 406,504 | | | 450 | | | — | | | — | | | — | | | — | | | 450 | | | | — | |
| Equity-based compensation | — | | | — | | | — | | | — | | | 1,380 | | | — | | | — | | | — | | | 1,380 | | | | — | |
| Repurchase of incentive units | — | | | — | | | — | | | — | | | (1,147) | | | — | | | — | | | — | | | (1,147) | | | | — | |
| Cumulative translation adjustment | — | | | — | | | — | | | — | | | — | | | 10,570 | | | — | | | 785 | | | 11,355 | | | | — | |
| Net income | — | | | — | | | — | | | — | | | — | | | — | | | 14,334 | | | 471 | | | 14,805 | | | | — | |
| Balance as of December 31, 2020 | — | | | — | | | 114,167,842 | | | 108,197 | | | 727 | | | 5,839 | | | 14,138 | | | 9,983 | | | 138,884 | | | | — | |
| Issuance of units | — | | | — | | | 25,746,282 | | | 82,669 | | | — | | | — | | | — | | | — | | | 82,669 | | | | — | |
| Noncontrolling interest from purchase of Culture Kings | — | | | — | | | — | | | — | | | — | | | — | | | — | | | — | | | — | | | | 142,718 | |
| Purchase of Petal & Pup noncontrolling interest | — | | | — | | | — | | | — | | | (10,599) | | | — | | | — | | | (9,599) | | | (20,198) | | | | — | |
| Purchase of Culture Kings noncontrolling interest | 21,809,804 | | | 22 | | | — | | | — | | | 132,256 | | | — | | | — | | | — | | | 132,278 | | | | (132,278) | |
| Reorganization transactions | 94,780,338 | | | 95 | | | (139,914,124) | | | (190,866) | | | 190,771 | | | — | | | — | | | — | | | — | | | | — | |
| Issuance of common stock upon initial public offering, net issuance costs | 10,000,000 | | | 10 | | | — | | | — | | | 95,711 | | | — | | | — | | | — | | | 95,721 | | | | — | |
| Issuance of common stock in the acquisition of mnml | 2,057,695 | | | 2 | | | — | | | — | | | 17,303 | | | — | | | — | | | — | | | 17,305 | | | | — | |
| Change in tax bases of Culture Kings’ assets related to purchase of Culture Kings’ noncontrolling interest | — | | | — | | | — | | | — | | | 19,595 | | | — | | | — | | | — | | | 19,595 | | | | — | |
| Equity-based compensation | — | | | — | | | — | | | — | | | 8,043 | | | — | | | — | | | — | | | 8,043 | | | | — | |
| Cumulative translation adjustment | — | | | — | | | — | | | — | | | — | | | (16,919) | | | — | | | (1,006) | | | (17,925) | | | | (9,694) | |
| Net income (loss) | — | | | — | | | — | | | — | | | — | | | — | | | (5,968) | | | 622 | | | (5,346) | | | | (746) | |
| Balance as of December 31, 2021 | 128,647,837 | | | $ | 129 | | | — | | | $ | — | | | $ | 453,807 | | | $ | (11,080) | | | $ | 8,170 | | | $ | — | | | $ | 451,026 | | | | $ | — | |
_________
(1)Excelerate, L.P. was the predecessor entity to a.k.a. Brands Holding Corp. Refer to Note 1 for additional information.
The accompanying notes are an integral part of these consolidated financial statements
a.k.a. BRANDS HOLDING CORP.
CONSOLIDATED STATEMENTS OF CASH FLOWS
(in thousands)
| | | | | | | | | | | | | | | | | |
| Year Ended December 31, |
| 2021 | | 2020 | | 2019 |
| Cash flows from operating activities: | | | | | |
| Net income (loss) | $ | (6,091) | | | $ | 14,805 | | | $ | 1,442 | |
| Adjustments to reconcile net income (loss) to net cash provided by operating activities: | | | | | |
| Depreciation expense | 2,694 | | | 353 | | | 467 | |
| Amortization expense | 14,016 | | | 6,409 | | | 5,760 | |
| Amortization of inventory fair value adjustment | 15,908 | | | — | | | — | |
| Amortization of debt issuance costs | 596 | | | — | | | — | |
| Non-cash interest expense | 11 | | | — | | | — | |
| Loss on extinguishment of debt | 10,924 | | | — | | | — | |
| Lease incentives | 361 | | | — | | | — | |
| Non-cash operating lease expense | 6,246 | | | — | | | — | |
| Equity-based compensation | 8,043 | | | 1,380 | | | 353 | |
| Deferred income taxes, net | (11,951) | | | (2,908) | | | (1,705) | |
| Changes in operating assets and liabilities, net of effects of acquisitions: | | | | | |
| Accounts receivable | (858) | | | (833) | | | (47) | |
| Inventory | (32,131) | | | (9,375) | | | (15,059) | |
| Prepaid expenses and other current assets | (11,543) | | | 20 | | | (2,707) | |
| Accounts payable | 6,038 | | | (2,776) | | | 5,115 | |
| Income taxes payable | (9,329) | | | 3,688 | | | (1,567) | |
| Accrued liabilities | 26,678 | | | 8,648 | | | 6,542 | |
| Returns reserve | 3,091 | | | 863 | | | 945 | |
| Deferred revenue | 7,197 | | | 1,493 | | | 1,133 | |
| Lease liabilities | (5,932) | | | (55) | | | (161) | |
| | | | | |
| Net cash provided by operating activities | 23,968 | | | 21,712 | | | 511 | |
Cash flows from investing activities: | | | | | |
Acquisition of businesses, net of cash acquired | (249,302) | | | (600) | | | (20,425) | |
| Purchase of noncontrolling interest | (20,198) | | | — | | | — | |
Purchase of intangible assets | (841) | | | (451) | | | (372) | |
| Purchases of property and equipment | (7,734) | | | (1,328) | | | (1,031) | |
Net cash used in investing activities | (278,075) | | | (2,379) | | | (21,828) | |
Cash flows from financing activities: | | | | | |
| Proceeds from initial public offering, net of issuance costs | 96,863 | | | — | | | — | |
| Proceeds from line of credit, net of issuance costs | 34,150 | | | 10,889 | | | — | |
| Repayment of line of credit | (42,204) | | | (10,099) | | | (1,581) | |
| Proceeds from issuance of debt, net of issuance costs | 254,134 | | | — | | | — | |
| Repayment of debt | (155,762) | | | — | | | — | |
| Proceeds from issuance of units | 82,669 | | | 450 | | | 22,164 | |
Net cash provided by financing activities | 269,850 | | | 1,240 | | | 20,583 | |
Effect of exchange rate changes on cash, cash equivalents and restricted cash | (1,824) | | | 735 | | | 482 | |
Net increase (decrease) in cash, cash equivalents and restricted cash | 13,919 | | | 21,308 | | | (252) | |
Cash, cash equivalents and restricted cash at beginning of period | 27,099 | | | 5,791 | | | 6,043 | |
Cash, cash equivalents and restricted cash at end of period | $ | 41,018 | | | $ | 27,099 | | | $ | 5,791 | |
a.k.a. BRANDS HOLDING CORP.
CONSOLIDATED STATEMENTS OF CASH FLOWS
(in thousands)
| | | | | | | | | | | | | | | | | |
| Year Ended December 31, |
| 2021 | | 2020 | | 2019 |
Reconciliation of cash, cash equivalents and restricted cash: | | | | | |
Cash and cash equivalents | $ | 38,832 | | | $ | 26,259 | | | $ | 5,472 | |
Restricted cash | 2,186 | | | 840 | | | 319 | |
| Total cash, cash equivalents and restricted cash | $ | 41,018 | | | $ | 27,099 | | | $ | 5,791 | |
Supplemental disclosure of cash flow information: | | | | | |
Interest paid | $ | 7,901 | | | $ | 278 | | | $ | 334 | |
Income taxes paid, net of refunds | 20,626 | | | 4,875 | | | 4,431 | |
Supplemental disclosure of non-cash investing activities: | | | | | |
Consideration payable in connection with a business acquisition | $ | 4,901 | | | $ | — | | | $ | 728 | |
| Fair value of common stock issued in connection with the purchase of mnml | 17,305 | | | — | | | — | |
| Right-of-use asset additions under operating leases | 4,073 | | | 2,740 | | | 233 | |
| Offering costs not yet paid | 1,142 | | | — | | | — | |
| Debt issuance costs not yet paid | 121 | | | — | | | — | |
The accompanying notes are an integral part of these consolidated financial statements
a.k.a. BRANDS HOLDING CORP.
NOTES TO CONSOLIDATED FINANCIAL STATEMENTS
(tabular amounts in thousands, except share, per share data, unit, per unit data, ratios, or as noted)
Note 1. Description of Business
a.k.a. Brands Holding Corp. (together with our wholly owned subsidiaries, collectively, the “Company”), which operates under the name “a.k.a. Brands” or “a.k.a.,” is an online fashion retailer focused on acquiring and accelerating the growth of next-generation, digitally native fashion brands targeting Gen Z and Millennial customers.
The Company is headquartered in San Francisco, California, with buying, studio, marketing, fulfillment and administrative functions primarily in Australia and the United States.
Initial Public Offering
In September 2021, the Company completed an initial public offering (the “IPO”), in which the Company issued and sold 10,000,000 shares of its newly authorized common stock for $11.00 per share for net proceeds of $95.7 million, after deducting underwriting discounts and commissions of $6.6 million, and offering costs of $7.7 million.
Reorganization Transactions
a.k.a. Brands Holding Corp. was formed as a Delaware corporation on May 20, 2021 to be the issuer of common stock in the IPO. Excelerate, L.P. (“Excelerate”), a Cayman limited partnership, and the predecessor entity to a.k.a. Brands Holding Corp., had historically been the holding company of the entities that owned and operated the a.k.a. businesses prior to the IPO. The equity interests of Excelerate, which included the Series A partner units and incentive units, were owned by affiliates of Summit Partners (“Summit”), certain other investors and certain of our executive officers and directors and other members of management.
In connection with the IPO, a reorganization was undertaken to cause Excelerate to become a wholly-owned subsidiary of a.k.a. Brands Holding Corp. Immediately prior to the reorganization, Summit, management and certain other investors exchanged their limited partnership interests in Excelerate for limited partnership interests in New Excelerate, L.P. (“New Excelerate”), and New Excelerate became a limited partner of Excelerate. Immediately prior to the pricing of the IPO, New Excelerate and other Excelerate investors transferred their interests in Excelerate to a.k.a. Brands Holding Corp., in exchange for common stock in a.k.a. Brands Holding Corp (the “New Excelerate Reorganization”). As a result, Excelerate became a wholly-owned subsidiary of a.k.a. Brands Holding Corp.
As a result of the Culture Kings acquisition in March 2021 (refer to Note 3 for additional information), Excelerate indirectly owned 55% of the equity interests in CK Holdings, LP (“CK Holdings”), which owned 100% of the Company’s Culture Kings business prior to the IPO. The remaining 45% of the equity interests in CK Holdings were held by certain minority investors. Immediately following the New Excelerate Reorganization, the Company completed a series of transactions in which the minority investors exchanged their remaining interests in CK Holdings for 21,809,804 newly issued shares of a.k.a. Brands Holding Corp. common stock. The number of shares issued in exchange for the minority interests was determined based on the relative valuations of CK Holdings and consolidated a.k.a. at the time of the IPO.
Excelerate had historically owned 66.7% of the equity interests in P&P Holdings, LP (“P&P Holdings”), which operated the Company’s Petal & Pup business prior to the IPO. The remaining 33.3% of the equity interests in P&P Holdings were held by certain minority investors. On August 19, 2021, the Company repurchased approximately 6.0% of the equity held by the P&P minority investors for AUD $5.0 million. In connection with the completion of the IPO, the Company used a portion of the net proceeds from the IPO to fund the acquisition of the remaining 27.3% of the equity interests in P&P Holdings then owned by the P&P minority investors for cash of approximately AUD $22.8 million. Following the completion of this purchase, P&P Holdings became a wholly-owned subsidiary of a.k.a. Brands Holding Corp.
Refinancing Transactions
In March 2021, certain subsidiaries of the Company entered into senior secured credit facilities that provided the Company with a $125.0 million senior secured term loan facility and up to $25.0 million aggregate principal in revolving borrowings (the “Fortress Credit Facilities”), and also issued $25.0 million in senior subordinated notes to an affiliate of Summit (the “Summit Notes”) to provide financing for the Company’s acquisition of Culture Kings (refer to Note 3 for additional information on the Culture Kings acquisition).
In connection with the IPO, certain subsidiaries of the Company entered into a new senior secured credit facility inclusive of a $100 million term loan and a $50 million revolving line of credit. The Company used borrowings under this new senior secured credit facility’s term loan, together with a portion of the proceeds from the IPO, to repay the Fortress Credit Facilities and Summit Notes in full and subsequently terminated them. Refer to Note 8 for additional information.
Historical Units
Prior to the IPO, incentive units had been issued to certain directors and members of management. These incentive units had a requirement that such shares could not participate in distributions and earnings of Excelerate, L.P. until after the holders of the Series A partner units received their return of capital plus a specified threshold amount per unit. Accordingly, at no time prior to IPO had such threshold been met. In September 2021, in connection with the IPO, all previous ownership interests in Excelerate, L.P., held by New Excelerate and other Excelerate investors were exchanged for shares of common stock in a.k.a. Brands Holdings Corp. in direct proportion to their respective Series A partner units and incentive units, subject to a reverse split factor of 61.25%. All unit, per unit and related information presented in the accompanying consolidated financial statements have been retroactively adjusted, where applicable, to reflect the impact of the split of units held by New Excelerate investors into a proportionate amount of shares of a.k.a. common stock. The terms of the incentive units remained unchanged and individual holders of such units will only be entitled to participate in the distributions and earnings of New Excelerate once the holders of the Series A partner units receive their return of capital plus a specified threshold amount per unit. However, as New Excelerate was issued shares of common stock in direct proportion to its combined Series A partner units and incentive units, New Excelerate will participate in all distributions and returns of the Company in relation to the total amount of shares of a.k.a. common stock that it holds.
Prior to the IPO, a.k.a. used the two-class method in calculating earnings per unit and had not deemed the incentive units to be potentially dilutive due to the requirement that such shares cannot participate in distributions and earnings of the Company until after the Series A units receive their return of capital plus a specified threshold amount per unit, and such threshold had not been met. Accordingly, basic and diluted earnings per share presented on the condensed consolidated statements of income for all periods prior to the IPO are the same. Post-IPO, the common stock held by New Excelerate includes shares issued in proportion to the ownership interests in respect to the incentive units. Therefore, the impact of the incentive unit ownership is included in the common stock issued and outstanding after the IPO.
Note 2. Significant Accounting Policies
Principles of Consolidation and Basis of Presentation
The accompanying consolidated financial statements have been prepared in accordance with accounting principles generally accepted in the United States of America (“GAAP”). The accompanying consolidated financial statements include the accounts of a.k.a. Brands Holding Corp. and its wholly-owned subsidiaries. All intercompany balances and transactions have been eliminated in consolidation.
Use of Estimates
The preparation of consolidated financial statements in conformity with GAAP requires management to make estimates and assumptions that affect the reported amounts of assets and liabilities, revenues and expenses, and related disclosures of contingent assets and liabilities in the consolidated financial statements and accompanying notes. Actual results could materially differ from those estimates. On an ongoing basis, the Company evaluates items subject to significant estimates and assumptions. As of December 31, 2021, the effects of the ongoing COVID-19 pandemic on our business, results of operations and financial condition continue to evolve. As a result, many of our estimates and assumptions require increased judgment and carry a higher degree of variability and volatility.
Concentration of Credit Risk
Financial instruments that subject the Company to credit risk consist of cash and cash equivalents, restricted cash, and accounts receivable. Although the Company’s deposits held with banks may exceed the amount of federal insurance provided on such deposits, the Company has not experienced any losses in such accounts. The Company is exposed to credit risk in the event of a default by the financial institutions holding its cash and cash equivalents for the amounts reflected on the consolidated balance sheets.
As of December 31, 2021 and 2020, the Company had $28.2 million and $10.9 million, respectively, on deposit in banks outside of the United States.
Cash and Cash Equivalents
The Company considers all highly liquid investments purchased with an original maturity (at date of purchase) of three months or less to be cash equivalents. Cash equivalents, which consist primarily of money market accounts and restricted cash are carried at cost, which approximates fair value.
Restricted Cash
Restricted cash primarily relates to letters of credit which are held as collateral under various lease agreements. Restricted cash is presented separately from cash and cash equivalents on the accompanying consolidated balance sheets.
Accounts Receivable
Accounts receivable consists of trade accounts receivable relating to the credit card receivables arising from the sale of products to customers through the Company’s digital platforms. Trade accounts receivable is reported net of an allowance for doubtful accounts. The Company had no allowance for doubtful accounts as of December 31, 2021 and 2020.
Inventory, Net
Inventories consist of finished goods and are accounted for using an average cost method. Inventory is valued at the lower of cost or net realizable value. Cost of inventory includes import duties and other taxes and transport and handling costs. The Company records a provision for excess and obsolete inventory to adjust the carrying value of inventory based on assumptions regarding future demand for the Company’s products.
Lower of cost or net realizable value is evaluated by considering obsolescence, excess levels of inventory, deterioration and other factors. The Company analyzes the quantity of inventory on hand, the quantity sold in the past year, the anticipated sales volume, the expected sales price and the cost of making the sale when evaluating the net realizable value of its inventory. If the sales volume or sales price of specific products declines, additional write-downs may be required. Excess and obsolete inventory is charged to cost of goods sold in the period the write-down is estimated.
Prepaid Expenses and Other Current Assets
Prepaid expenses and other current assets consist primarily of advance payments on inventory to be delivered from vendors, prepaid packaging and insurance.
Deferred Offering Costs
Deferred offering costs consist primarily of legal, accounting and other fees related to the IPO which were recorded in prepaid expenses and other current assets on the consolidated balance sheets prior to the IPO. After the completion of the IPO in September 2021, deferred offering costs of $7.7 million were reclassified to stockholders’ equity and recorded net against the proceeds from the IPO. No offering costs were deferred as of December 31, 2021 or 2020.
Property and Equipment, Net
Property and equipment are recorded at cost, net of accumulated depreciation. Repair and maintenance costs are expensed as incurred.
Depreciation is calculated using the straight-line method over the estimated useful lives of the assets, which range from three to five years.
| | | | | |
| Estimated useful life (years) |
| Furniture and fixtures | 5 |
| Machinery and equipment | 5 |
| Computer equipment and capitalized software | 3 |
| Buildings and leasehold improvements | Shorter of the lease term or the estimated life of the assets |
Upon the sale or disposal of property and equipment, the cost and related accumulated depreciation and amortization are removed from the consolidated balance sheets and the resulting gain or loss is reflected in general and administrative expense in the consolidated statements of income.
The Company has incurred costs related to the development of the Company’s websites. The Company capitalizes these website development costs, as applicable, in accordance with ASC Subtopic 350-50, Intangibles—Goodwill and Other—Website Development Costs (“ASC 350-50”). ASC 350-50 requires that costs incurred during the website development stage be capitalized. Capitalized website costs include salary and benefit costs for Company employees and contractors that develop the website. When the development phase is substantially complete and the website is ready for its intended purpose, capitalized costs are depreciated using the straight-line method over the three-year useful life.
Business Combinations
The Company accounts for business combinations using the acquisition method and accordingly, the identifiable assets acquired, the liabilities assumed, and any noncontrolling interest in the acquiree are recorded at their acquisition date fair values. Goodwill is recorded as the difference, if any, between the aggregate consideration paid for an acquisition and the fair value of the acquired net tangible and intangible assets. Goodwill recorded in an acquisition is assigned to applicable reporting units based on expected revenues or expected cash flows. Identifiable intangible assets with finite lives are amortized over their useful lives. Amortization of intangible assets is recorded in general and administrative expense.
While the Company uses its best estimates and assumptions as a part of the determination of fair value to accurately value assets acquired, liabilities assumed and any noncontrolling interest on the business combination date, the Company’s estimates and assumptions are inherently subject to refinement. As a result, during the preliminary determination of fair value, which may be up to one year from the business combination date, the Company may record adjustments to the assets acquired or liabilities assumed subsequent to the completion of the determination of fair value in the Company’s operating results in the period in which the adjustments were determined.
Noncontrolling interest is part of the aggregate consideration paid for an acquisition. It is measured at the minorities’ share of the fair value of the subsidiaries’ identifiable assets and liabilities at the date of acquisition by the Company, subject to possible adjustments for up to one year from the business combination date, and the minorities’ share of changes in equity since the date of acquisition.
The Company also incurs acquisition-related and other expenses including legal, banking, accounting and other advisory fees of third parties which are recorded as general and administrative expenses as incurred. The results of operations of acquired businesses are included in the consolidated financial statements from the acquisition date.
Goodwill, Intangible Assets and Other Long-Lived Assets
Assets acquired and liabilities assumed are measured at fair value as of the acquisition date. Goodwill, which has an indefinite useful life, represents the excess of cost over fair value of the net assets acquired. As of December 31, 2021 and 2020, the Company had goodwill of $363.3 million and $88.3 million, respectively.
Goodwill represents the excess of the purchase price over the fair value of net assets, including the amount assigned to identifiable intangible assets. The primary drivers that generate goodwill are the value of synergies between the acquired entities and the Company and the acquired assembled workforce, neither of which qualifies as a separately identifiable intangible asset.
Goodwill is tested for impairment at least annually, in the fourth quarter and whenever changes in circumstances indicate an impairment may exist. The goodwill impairment test is performed at the reporting unit level, which is generally at the level of or one level below an operating segment. Generally, a qualitative assessment is first performed to determine whether a quantitative goodwill impairment test is necessary. If management determines, after performing an assessment based on the qualitative factors, that the fair value of the reporting unit is more likely than not less than the carrying amount, or that a fair value of the reporting unit substantially in the excess of the carrying amount cannot be assured, then a quantitative goodwill impairment test would be required. The quantitative test for goodwill impairment is performed by determining the fair value of the related reporting units. Fair value is measured based on the discounted cash flow method and relative market-based approaches. An impairment charge is recorded equal to any shortfall between the fair value of a reporting unit and its carrying value.
No goodwill impairment was recorded for the years ended December 31, 2021, 2020 and 2019.
Impairment of Long-Lived Assets
The Company reviews long-lived assets for possible impairment whenever events or changes in circumstances indicate the carrying amount may not be recoverable. This determination includes evaluation of factors such as future asset utilization and future net undiscounted cash flows expected to result from the use of the assets. If circumstances require a long-lived asset or asset group be tested for possible impairment, the Company first compares undiscounted cash flows expected to be generated by that asset group to its carrying amount. If the carrying amount of the long-lived asset or asset group is not recoverable on an undiscounted cash flow basis, an impairment is recognized to the extent that the carrying amount exceeds its fair value.
The Company’s identifiable intangible assets are typically comprised of customer relationships, brand names and acquired core website software. The cost of identifiable assets with finite lives is generally amortized on a straight-line basis over the assets’ respective estimated useful lives, which range from three to ten years.
No impairment losses were recognized during the years ended December 31, 2021, 2020 and 2019.
Leases
The Company generally leases office and warehouse facilities under non-cancellable agreements. Upon each agreement’s commencement date, the Company determines if the agreement is part of an arrangement that is or that contains a lease, determines the lease classification and recognizes right-of-use assets and lease liabilities for all leases with the exception of leases with terms of 12 months or less. The Company accounts for lease and non-lease components as a single lease component. Operating lease right-of-use assets are classified in operating lease right-of-use assets in the consolidated balance sheets. Operating lease liabilities are classified as current liabilities and long-term lease liabilities based on when lease payments are due. The Company’s lease payments consist primarily of fixed rental payments for the right to use the underlying leased assets over the lease terms as well as payments for common area maintenance and administrative services. As of December 31, 2021 and 2020, the Company did not have material finance lease arrangements.
Lease liabilities and their corresponding right-of-use assets are recorded based on the present value of lease payments over the expected term of the lease commencement date. As most of the Company’s leases do not provide an implicit rate, the Company uses an estimated incremental borrowing rate (“IBR”) based on the information available at the commencement date of the respective lease to determine the present value of future payments. The determination of the IBR requires judgment and is primarily based on publicly available information for companies within the same industry and with similar credit profiles. The Company adjusts the rate for the impact of collateralization, the lease term and other specific terms included in each lease arrangement. The IBR is determined at the lease commencement and is subsequently reassessed upon a modification to the lease arrangement. The right-of-use asset also includes any lease payments made prior to the commencement date and excludes lease incentives and initial direct costs incurred.
Lease expense for minimum lease payments on operating leases is recognized on a straight-line basis over the lease term. Lease terms may include options to extend or terminate the lease when it is reasonably certain that the Company will exercise that option.
The Company reviews right-of-use assets for impairment whenever events or changes in circumstances indicate that the carrying amount of the right-of-use asset may not be recoverable. When such events occur, the Company compares the carrying amount of the right-of-use asset to the undiscounted expected future cash flows related to the right-of-use asset. If the comparison indicates that an impairment exists, the amount of the impairment is calculated as the difference between the excess of the carrying amount over the fair value of the right-of-use asset. If a readily determinable market price does not exist, fair value is estimated using discounted expected cash flows attributable to the right-of-use asset.
Income Taxes
Income taxes are accounted for under the asset and liability method. Deferred tax assets and liabilities are recognized for the future tax consequences attributable to differences between the financial statement carrying amounts of existing assets and liabilities and their respective tax bases and are recorded net on the face of the balance sheet. Deferred tax assets and liabilities are measured using enacted tax rates expected to apply to taxable income in the years in which those temporary differences are expected to be recovered or settled. The effect on deferred tax assets and liabilities of a change in tax rates is recognized in income in the period that includes the enactment date.
Deferred tax assets are recognized to the extent it is believed that these assets are more likely than not to be realized. In assessing the realizability of deferred tax assets, management considers whether it is more likely than not that some portion or all of the deferred tax assets will not be realized. The ultimate realization of deferred tax assets is dependent upon the generation of future taxable income during the periods in which those temporary differences become deductible. Management considers the scheduled reversal of deferred tax liabilities (including the impact of available carry back and carry forward periods), projected future taxable income and tax planning strategies in making this assessment. Based upon the level of historical taxable income and projections for future taxable income over the periods in which the deferred tax assets are deductible, management believes it is more likely than not that the Company will realize the benefits of these deductible differences, net of the valuation allowance. The amount of the deferred tax asset considered realizable, however, could be reduced in the near term if estimates of future taxable income during the carry forward period are reduced.
The Company classifies interest and penalties, if applicable, related to income tax liabilities as a component of income tax expense.
The Company uses a two-step approach to recognizing and measuring uncertain tax positions. The first step is to evaluate the tax position for recognition by determining if the weight of available evidence indicates that it is more likely than not that the position will be sustained on audit, including resolution of related appeals and litigation processes, if any. The second step is to measure the largest amount of tax benefit as the largest amount that is more likely than not to be realized upon settlement.
Changes in recognition or measurement are reflected in the period in which the change in judgment occurs. As of December 31, 2021, there are no known uncertain tax positions.
Equity-based Compensation
Restricted Stock Units and Stock Options
The Company has granted equity-based awards in the form of restricted stock units and stock options to employees. Equity-based compensation expense related to these equity-based awards is recognized based on the fair value of the awards granted. We estimate the fair value of restricted stock unit awards granted based upon the closing price of our common stock on the grant date. We estimate the fair value of stock option awards granted using the Black-Scholes option pricing model. The Black-Scholes option pricing model requires the input of highly subjective assumptions, including the fair value of the underlying shares of our common stock, the risk-free interest rate, the expected volatility of the price of our common stock, the expected dividend yield of our common stock and the expected term of the equity award. The assumptions used to determine the fair value of the equity awards represent management’s best estimates. These estimates involve inherent uncertainties and the application of management’s judgment. The related equity-based compensation expense is recognized on a straight-line basis over the requisite service period of the awards, which is generally four years. We account for forfeitures as they occur. If factors change and different assumptions are used, our equity-based compensation expense could be materially different in the future.
These assumptions and estimates are as follows:
•Risk-Free Interest Rate. The risk-free interest rate for the expected term of the equity award is based on the U.S. Treasury yield curve in effect at the time of the grant.
•Expected Volatility. As we have minimal trading history for our common stock, the expected volatility was estimated by taking the average historic stock price volatility for industry peers, consisting of several public companies in our industry which are either similar in size, stage of life cycle or financial leverage, over a period equivalent to the expected term of the awards.
•Expected Dividend Yield. We have never declared or paid any cash dividends and do not currently plan to pay cash dividends in the foreseeable future. As a result, an expected dividend yield of zero percent was used.
•Expected Term. For stock options, the expected term represents the period that a stock option award is expected to be outstanding. We have limited historical exercise data from which to derive expected term input assumptions. Consequently, we calculate expected term using the SEC simplified method whereby the expected term of a stock option award is equal to the average of the award's contractual term and vesting term.
We will continue to use judgment in evaluating the assumptions related to our equity-based compensation on a prospective basis.
Partnership Units Valuations
For the partnership units granted prior to IPO, the Company relied on valuations prepared by an independent third-party valuation firm in accordance with the American Institute of Certified Public Accountants Accounting and Valuation Guide, Valuation of Privately-Held Company Equity Securities Issued as Compensation, Such valuations were aligned with the Company’s internal valuation approach. Subsequent to the IPO, it is no longer necessary for the Company to estimate the fair value of its partnership units, as no further incentive partnership unit awards will be granted subsequent to the IPO. See Note 12 for additional information.
Employee Benefit Programs
The Company has a 401(k) defined contribution plan covering eligible employees. Participants may contribute a percentage of their pre-tax earnings annually, subject to limitations imposed by the Internal Revenue Service.
The Company matches contributions, subject to Internal Revenue Service limitations, and contributions vest immediately.
The Company’s short-term obligations, which represent wages and salaries for vacation days earned, non-monetary benefits and accumulated sick leaves that are expected to settle wholly within 12 months after the end of the period in which the employees render the related service, are recognized in respect of employee services up to the end of the reporting period and are measured at the amounts expected to be paid when the liabilities are settled. The liabilities are included in accrued liabilities in the consolidated balance sheets.
Foreign Currencies
The functional currency for the Company and its United States and Cayman subsidiaries is the United States dollar, while the functional currency for the Company’s Australian subsidiaries is the Australian dollar. For those subsidiaries, the assets and liabilities are translated into U.S. dollars at the exchange rates in effect at the balance sheet date for assets and liabilities and an average rate for each period for revenues and expenses. Translation adjustments are recorded as a component of accumulated other comprehensive income (loss) in the consolidated statement of stockholders’ equity.
Transactions denominated in a currency other than the functional currency of the entity involved give rise to foreign currency remeasurement gains and losses, which are included in other expense on the consolidated statements of income. Foreign currency transaction losses were $1.7 million, $0.2 million and $0.1 million for the years ended December 31, 2021, 2020 and 2019, respectively.
Comprehensive Income (Loss)
Comprehensive income (loss) is composed of two components: net income (loss) and other comprehensive income (loss). Other comprehensive income (loss) refers to revenue, expenses, gains and losses that under GAAP are recorded as an element of stockholders’ equity but are excluded from net income. The Company’s other comprehensive income (loss) consists of foreign currency translation adjustments from those subsidiaries not using the U.S. dollar as their functional currency. The Company has disclosed other comprehensive income (loss) as a component of stockholders’ equity.
Revenue Recognition
Revenue is primarily derived from the sale of apparel merchandise through the Company’s online websites and stores and, when applicable, shipping revenue.
Revenue is recognized in an amount that reflects the consideration expected to be received in exchange for products. To determine revenue recognition for contracts with customers in accordance with Revenue from Contracts with Customers (Topic 606), the Company recognizes revenue from the commercial sales of products and contracts by applying the following five steps: (1) identification of the contract, or contracts, with the customer; (2) identification of the performance obligations in the contract; (3) determination of the transaction price; (4) allocation of the transaction price to the performance obligations in the contract; and (5) recognition of revenue when, or as, the Company satisfies its performance obligation. A contract is created with the customer at the time the order is placed by the customer, which creates a single performance obligation. The Company recognizes revenue for its single performance obligation at the time control of the product passes to the customer, which is when the goods are transferred to a third-party common carrier, for purchases through the Company’s online websites, or at point of sale, for purchases in our stores. In addition, the Company has elected to treat shipping and handling as fulfillment activities and not a separate performance obligation.
Net sales from product sales includes shipping charged to the customer and is recorded net of taxes collected from customers, which are recorded in accrued liabilities and are remitted to governmental authorities. Cash discounts earned by the customers at the time of purchase and estimates for sales return allowances are deducted from gross revenue in determining net sales.
The Company generally provides refunds for goods returned within 30 to 45 days from the original purchase date. A returns reserve is recorded by the Company based on historical refund experience with a corresponding reduction of sales and cost of sales. The returns reserve was $6.9 million and $3.5 million as of December 31, 2021 and 2020, respectively.
The following table presents a summary of the Company’s sales return reserve:
| | | | | | | | | | | |
| December 31, |
| 2021 | | 2020 |
| Beginning balance | $ | 3,517 | | | $ | 2,585 | |
| Returns | (80,915) | | | (36,796) | |
| Allowance | 84,285 | | | 37,728 | |
| Ending balance | $ | 6,887 | | | $ | 3,517 | |
The Company also sells gift cards and issues online credits in lieu of cash refunds or exchanges. Proceeds from the issuance of gift cards and online credits issued are recorded as deferred revenue and recognized as revenue when the gift cards or online credit are redeemed or, upon inclusion in gift card and online credit breakage estimates. Breakage estimates are determined based on prior historical experience.
Revenue recognized in net sales on breakage of gift cards and online credit for the years ended December 31, 2021, 2020 and 2019 was $0.5 million, $0.7 million and $0.4 million, respectively.
The following table presents the disaggregation of the Company’s net revenues by geography, based on customer address:
| | | | | | | | | | | | | | | | | |
| Year Ended December 31, |
| 2021 | | 2020 | | 2019 |
| United States | $ | 270,028 | | | $ | 125,179 | | | $ | 45,280 | |
| Australia | 218,563 | | | 67,850 | | | 47,176 | |
| Rest of world | 73,600 | | | 22,887 | | | 9,984 | |
| Total | $ | 562,191 | | | $ | 215,916 | | | $ | 102,440 | |
Cost of Sales
Cost of sales consists of the purchase price of merchandise sold to customers and includes import duties and other taxes, freight-in, defective merchandise returned from customers, inventory write-offs and other miscellaneous shrinkage.
Selling Expenses
Selling expenses consist of costs incurred in operating and staffing the fulfillment centers and stores, costs attributable to inspecting and warehousing inventory, picking, packaging and preparing customer orders for shipment, customer service, shipping and other transportation costs incurred delivering merchandise to customers and customers returning merchandise, merchant processing fees, and shipping supplies. The amount of shipping and handling costs included in selling expenses was $70.7 million, $34.1 million and $16.7 million for the years ended December 31, 2021, 2020 and 2019, respectively.
Marketing
Marketing expenses are expensed as incurred and consist primarily of targeted online performance marketing costs, such as display advertising, retargeting, paid search/product listing ads, affiliate marketing, paid social, search engine optimization, personalized email marketing, social media advertising and mobile “push” communications through the Company’s apps. Marketing expenses also include the Company’s spend on brand marketing channels, including cash compensation to influencers, events and other forms of online and offline marketing. Marketing expenses are primarily related to growing and retaining the customer base. Advertising costs are expensed as incurred.
General and Administrative
General and administrative expenses consist primarily of payroll and related benefit costs and equity-based compensation expense for employees involved in general corporate functions including merchandising, marketing and technology, as well as costs associated with the use by these functions of facilities and equipment, including depreciation, rent and other occupancy expenses.
Other Expense, Net
Other expense, net, consists primarily of $10.9 million of loss on extinguishment of debt for the year ended December 31, 2021, interest expense of $9.5 million, $0.3 million and $0.3 million for the years ended December 31, 2021, 2020 and 2019, respectively, and foreign currency losses of $1.7 million, $0.2 million and $0.1 million for the years ended December 31, 2021, 2020 and 2019, respectively.
Net Income (Loss) Per Share
Basic net income (loss) per share is calculated using net income attributable to common stockholders divided by the weighted-average number of common shares outstanding during the period. Diluted net income (loss) per share reflects the dilutive effects of stock options and restricted stock units outstanding during the period, to the extent such securities would not be anti-dilutive, and is determined using the treasury stock method.
Fair Value Measurements
The Company utilizes valuation techniques that maximize the use of observable inputs and minimize the use of unobservable inputs to the extent possible. The Company determines fair value based on assumptions that market participants would use in pricing an asset or liability in the principal or most advantageous market. The carrying amounts for the Company’s cash and cash equivalents, accounts receivable, accounts payable, line of credit and accrued liabilities approximate fair value due to their short-term maturities. When considering market participant assumptions in fair value measurements, the following fair value hierarchy distinguishes between observable and unobservable inputs, which are categorized in one of the following levels:
•Level 1 Inputs: Unadjusted quoted prices in active markets for identical assets or liabilities.
•Level 2 Inputs: Other than quoted prices included in Level 1 inputs that are observable for the asset or liability, either directly or indirectly, for substantially the full-term of the asset or liability.
•Level 3 Inputs: Unobservable inputs for the asset or liability used to measure fair value to the extent that observable inputs are not available, thereby allowing for situations in which there is little, if any, market activity for the asset or liability at measurement date.
The Company considers all highly liquid investments purchased with a maturity of three months or less to be cash equivalents. The Company held cash in operating accounts as of December 31, 2021 and 2020.
Certain Risks and Concentrations
The Company is subject to certain risks, including dependence on third-party technology providers and hosting services for website servers, exposure to risks associated with online commerce security, credit card fraud, as well as the interpretation of state and local laws and regulations in regard to the collection and remittance of sales and use taxes. The Company does not have significant customer or vendor concentrations.
Segment Information
Operating segments are defined as components of an entity for which separate financial information is available and is regularly reviewed by the Chief Operating Decision Maker (“CODM”) in deciding how to allocate resources and in assessing performance. The Company has determined that its five brands are each an operating segment. The Company has aggregated its operating segments into one reportable segment based on the similar nature of products sold, production, merchandising and distribution processes involved, target customers and economic characteristics.
Recently Adopted Accounting Pronouncements
In August 2018, the Financial Accounting Standards Board (“FASB”) issued Accounting Standards Update (“ASU”) No. 2018-13, Fair Value Measurement (Topic 820): Disclosure Framework—Changes to the Disclosure Requirements for Fair Value Measurement, which amended its conceptual framework to improve the effectiveness of disclosures around the amount of, and reasons for, transfers between Level 1 and Level 2 of the fair value hierarchy. This guidance also adds new disclosure requirements for Level 3 measurements. The Company adopted this guidance on January 1, 2020, and the adoption did not have a material impact on its consolidated financial statements.
In January 2017, the FASB issued ASU No. 2017-04, Simplifying the Test for Goodwill Impairment. The ASU amended existing guidance to simplify the subsequent measurement of goodwill by eliminating Step 2 from the goodwill impairment test by comparing the fair value of a reporting unit with its carrying amount and recognizing an impairment charge for the amount by which the carrying amount exceeds the reporting unit’s fair value, not to exceed the total amount of goodwill allocated to that reporting unit. The amendments were effective beginning in 2020. The adoption did not have a material impact on the Company’s consolidated financial statements.
New Accounting Pronouncements Not Yet Adopted
In December 2019, the FASB issued ASU 2019-12, Income Taxes (Topic 740): Simplifying the Accounting for Income Taxes. This standard simplifies the accounting for income taxes by eliminating certain exceptions to the guidance in Topic 740 related to the approach for intraperiod tax allocation, the methodology for calculating income taxes in an interim period, and the recognition of deferred tax liabilities for outside basis differences. The guidance also simplifies aspects of the accounting for franchise taxes and enacted changes in tax laws or rates and clarifies the accounting for transactions that result in a step-up in the tax basis of goodwill and the allocation of consolidated income taxes to separate financial statements of entities not subject to income tax. ASU 2019-12 will be effective for the Company on January 1, 2022. Upon adoption, the Company must apply certain aspects of this standard retrospectively for all periods presented while other aspects are applied on a modified retrospective basis through a cumulative-effect adjustment to retained earnings as of the beginning of the fiscal year of adoption. The Company is currently evaluating the impact of this update on its consolidated financial statements and related disclosures.
In March, 2020, the FASB issued ASU 2020-04, Reference Rate Reform (ASC 848): Facilitation of the Effects of Reference Rate Reform on Financial Reporting. The pronouncement provides companies with guidance to ease the process of migrating away from LIBOR and other interbank offered rates to new reference rates. ASC 848 contains optional expedients and exceptions for applying GAAP to contracts, hedging relationships, and other transactions affected by reference rate reform, subject to meeting certain criteria that reference LIBOR or another reference rate expected to be discontinued. The Company is currently evaluating the impact of this update on its consolidated financial statements and related disclosures.
Note 3. Acquisitions
Petal & Pup
On August 9, 2019, the Company acquired 66.7% of the share capital of Petal & Pup Limited (“Petal & Pup”) for an aggregate cash consideration of AUD $29.4 million, net of cash acquired of AUD $3.1 million (US $19.9 million, net of cash acquired of $2.1 million) and consideration payable of AUD $0.9 million ($0.6 million). In connection with the IPO, the Company acquired the remaining 33.3% (refer to Note 1 for additional information).
The acquisition expanded the Company’s customer following and products into online apparel for female customers in their twenties or thirties and provides the Company with an Australian brand that can be expanded into the North American market.
The fair values of assets acquired, liabilities assumed and noncontrolling interest as of the date of the acquisition, are as follows:
| | | | | |
Trade receivables | $ | 6 | |
Inventory | 630 | |
Prepaid expenses and other current assets | 78 | |
Property and equipment, net | 93 | |
Operating lease right-of-use assets | 430 | |
Intangible assets | 7,695 | |
Trade and other payables | (1,218) | |
Deferred tax liability | (2,272) | |
Current tax liabilities | (407) | |
Operating lease liabilities | (430) | |
Total net assets acquired | 4,605 | |
Fair value of noncontrolling interest | (8,314) | |
Goodwill | 24,214 | |
Total purchase price, net of cash acquired of $2,109 | $ | 20,505 | |
The acquisition was accounted for as a business combination. The following table summarizes the identifiable intangible assets acquired as of the date of the acquisition:
| | | | | | | | | | | |
| Fair Value at Acquisition Date | | Amortization Period |
| Brand | $ | 5,112 | | | 10 years |
| Customer relationships | 2,583 | | | 4 years |
| Total intangible assets | $ | 7,695 | | | |
The fair value of the noncontrolling interest is determined by measuring the fair value of the subsidiaries’ identifiable assets and liabilities at the date of acquisition, adjusted for a discount to factor the non-marketable, noncontrolling holding.
The results of operations of Petal & Pup are included in the Company’s consolidated results beginning August 9, 2019. Total net sales of $9.4 million and net income attributable to the Company of less than $0.1 million of Petal & Pup are included in the accompanying consolidated statement of income for the year ended December 31, 2019. Goodwill of $24.2 million, none of which is deductible for tax purposes, represents the excess purchase price over the estimated fair values assigned to tangible and identifiable intangible assets acquired and liabilities assumed. The goodwill arising from the acquisition consists largely of anticipated synergies related to combining with the Company’s existing operations.
Total acquisition costs incurred by the Company in connection with the purchase primarily related to third-party legal, accounting and tax diligence fees, were $0.7 million. These costs are recorded in general and administrative expenses in the consolidated statement of income during the year ended December 31, 2019.
Rebdolls
On December 6, 2019, the Company acquired 100% of the share capital of Rebdolls, Inc. (“Rebdolls”), a New Jersey corporation, for $0.6 million, which consisted of upfront cash consideration of $0.5 million and the fair value of contingent consideration of $0.1 million. The conditions were ultimately not met in relation to the contingent consideration.
The acquisition provides the Company with a brand that offers apparel with a full range of sizes from 0 to 32 with an emphasis on size inclusivity, focused on female customers age 18 to 34. As part of the purchase price allocation, the Company recorded $0.1 million in inventory, $0.1 million in identifiable intangible assets and $0.5 million in goodwill.
The results of operations of Rebdolls, Inc. are included in the Company’s consolidated results beginning December 6, 2019. Total net sales of $0.1 million in 2019 and net loss attributable to the Company of $0.2 million are included in the accompanying consolidated statement of income for the year ended December 31, 2019. The acquisition costs incurred for this purchase agreement were immaterial.
Culture Kings
On March 31, 2021, pursuant to a share sale agreement, the Company, through its subsidiary CK Holdings, acquired a 55% ownership stake in Culture Kings. The previous shareholders of Culture Kings retained a 45% noncontrolling interest in Culture Kings by receipt of an equity interest in CK Holdings. The Company recognized goodwill as the excess of the fair value of the total purchase consideration and noncontrolling interests over the net fair value of the identifiable assets acquired and the liabilities assumed. The purchase price consisted of AUD $307.4 million ($235.9 million) in cash consideration and noncontrolling interest with a fair value of AUD $186.0 million ($142.7 million). In connection with the IPO, the Company completed a series of transactions in which the minority investors exchanged their interests in CK Holdings for newly issued shares of a.k.a. Brands Holding Corp. common stock (refer to Note 1 for additional information).
Culture Kings is focused on street apparel aimed at the young adult age group and has a combination of online sales as well as stores based in Australia and expands the Company’s consumer market to include male consumers and further expansion in the United States.
The following table sets forth the allocation of the total consideration to the identifiable tangible and intangible assets acquired and liabilities assumed, as of the date of the acquisition, with the excess recorded to goodwill:
| | | | | |
| Purchase consideration: | |
Total purchase price, net of cash acquired of $8,831 | $ | 227,053 | |
Fair value of noncontrolling interest | 142,717 | |
Total consideration | $ | 369,770 | |
| |
| Identifiable net assets acquired: | |
Account receivable, net | $ | 625 | |
Inventory (1) | 62,937 | |
Prepaid expenses and other current assets | 4,800 | |
Property and equipment, net | 8,048 | |
Intangible assets, net (2) | 73,209 | |
Operating lease right-of-use assets | 24,299 | |
Accounts payable | (13,449) | |
Deferred revenue | (141) | |
Income taxes payable | (1,778) | |
Other current liabilities | (2,533) | |
Operating lease liabilities | (24,299) | |
Deferred income taxes, net | (25,439) | |
Accrued liabilities, non-current | (1,058) | |
Net assets acquired | 105,221 | |
Goodwill | $ | 264,549 | |
The purchase price allocation includes significant judgments, assumptions and estimates to determine the fair value of assets acquired and liabilities assumed. The valuations involving the most significant assumptions, estimates and judgment are:
(1)Inventory was adjusted by $15.1 million to step-up inventory cost to estimated fair value. The fair value of the inventory was determined utilizing the net realizable value method, which was based on the expected selling price of the inventory to customers adjusted for related disposal costs and a profit allowance for the post-acquisition selling effort.
(2)The fair value of the acquired intangible assets was determined with the assistance of a valuation specialist and include:
| | | | | | | | | | | | | | | | | |
| Estimated Fair Value | | Annual Amortization Expense | | Estimated Useful Life in Years |
Brand names | $ | 68,354 | | | $ | 6,835 | | | 10 years |
Customer relationships | 4,855 | | | 1,214 | | | 4 years |
| Total | $ | 73,209 | | | | | |
Brand names are valued using a relief from royalty approach, which estimates the license fee that would need to be paid by Culture Kings if it was deprived of the brand names and domain names, and instead had to pay a license fee for their use. The fair value is the present value of the expected future license fee cash flows.
Customer relationship intangible assets are valued using the multi-period excess earnings method, which is the present value of the projected cash flows that are expected to be generated by the existing intangible asset after reduction by an estimated fair rate of return on contributory assets required to generate the customer relationship revenues. Key assumptions included discounted cash flow, estimated life cycle and customer attrition rates.
Total acquisition costs incurred by the Company in connection with its purchase of Culture Kings primarily related to third-party legal, accounting and tax diligence fees, were $3.3 million. These costs are recorded in general and administrative expenses in the condensed consolidated statement of income for the year ended December 31, 2021.
Goodwill of $264.5 million, none of which is deductible for tax purposes, represents the excess purchase price over the estimated fair value assigned to tangible and identifiable intangible assets acquired and liabilities assumed. The goodwill arising from the acquisition consists largely of anticipated synergies related to combining with the Company’s existing operations.
The fair value of the noncontrolling interest was determined by measuring the fair value of the subsidiaries’ identifiable assets and liabilities at the date of acquisition, adjusted for a discount to factor the non-marketable, noncontrolling holding.
The noncontrolling interest in Culture Kings contained a put right whereby the minority investors could have caused CK Holdings to purchase all of their units at a per unit price equal to six times the EBITDA of CK Holdings, calculated as of the twelve-month period ending on the end of the most recent fiscal quarter. The put right was only exercisable after December 31, 2023. In accordance with ASC 810, Consolidation, as this put right was redeemable outside of the Company’s control, the noncontrolling interest was classified outside the permanent equity section of the Company’s consolidated balance sheets prior to the IPO. In connection with the IPO, the Company completed a series of transactions in which the CK Holdings minority investors exchanged their interests in CK Holdings for newly issued shares of a.k.a. Brands Holding Corp. common stock, thereby eliminating the noncontrolling interest classified outside of permanent equity.
Since the date of acquisition, March 31, 2021, the results of Culture Kings have been included in the Company’s consolidated results. The following amounts are included in the accompanying consolidated statement of income for the year ended December 31, 2021:
| | | | | |
| Year Ended December 31, 2021 |
Net sales | $ | 196,471 | |
Net loss | $ | (5,899) | |
The unaudited pro forma financial information below is presented to illustrate the estimated effects of the acquisition of Culture Kings and the associated financing as if they had occurred on January 1, 2020:
| | | | | | | | | | | |
| Year Ended December 31, |
| 2021 | | 2020 |
Net sales | $ | 613,390 | | | $ | 385,048 | |
Net income attributable to a.k.a. Brands Holding Corp. | $ | 16,781 | | | $ | 9,238 | |
Net income per share, basic and diluted: | $ | 0.17 | | | $ | 0.11 | |
The pro forma information was prepared using the acquisition method of accounting in accordance with ASC 805, Business Combinations. Since this pro forma financial information has been prepared based on preliminary estimates of consideration and fair values, including the identifiable intangibles, the actual amounts eventually recorded for the Culture Kings Acquisition may differ materially from the information herein. The unaudited pro forma financial information has been prepared for informational purposes only and is not indicative of what the Company’s results of operations would have been had the transactions occurred on January 1, 2020, nor does it project the results of operations of the combined company following the transaction.
mnml
On October 14, 2021, the Company acquired all of the equity interests of Third Estate LLC (“mnml”) for total consideration of $46.1 million, including cash consideration of $28.2 million, net of cash acquired of $0.6 million, and subject to working capital adjustments. The remaining consideration of $17.3 million was paid in the form of 2,057,695 shares of a.k.a. common stock. mnml is an LA-based streetwear brand that offers competitively priced on-trend wardrobe staples. This acquisition will help the Company continue its growth into the US market and provide opportunities for customer cross-sell.
The estimated fair values of assets acquired and liabilities assumed as of the date of the acquisition, are as follows:
| | | | | |
Accounts receivable, net | $ | 68 | |
Inventory (1) | 7,321 | |
Prepaid expenses and other current assets | 2,178 | |
Other assets | 15 | |
Intangible assets (2) | 14,300 | |
Accounts payable | (504) | |
Deferred income | (164) | |
Accrued liabilities | (1,794) | |
Assumed loan | (1,312) | |
Sales and use tax liability | (1,100) | |
Deferred income taxes, net | (3,159) | |
Total net assets acquired | 15,849 | |
Goodwill | 29,650 | |
Total purchase price, net of cash acquired of $605 | $ | 45,499 | |
The cash purchase consideration is subject to working capital adjustments that will be concluded before the one-year anniversary of the close of the transaction. The preliminary purchase price allocation includes significant judgments, assumptions and estimates to determine the fair value of assets acquired and liabilities assumed. The valuations involving the most significant assumptions, estimates and judgment are:
(1)Inventory was adjusted by $1.9 million to step-up inventory cost to estimated fair value. The fair value of the inventory was determined utilizing the net realizable value method, which was based on the expected selling price of the inventory to customers adjusted for related disposal costs and a profit allowance for the post-acquisition selling effort.
(2)The fair value of the acquired intangible assets was determined with the assistance of a valuation specialist and include:
| | | | | | | | | | | |
| Fair Value at Acquisition Date | | Amortization Period |
| Brand | $ | 11,800 | | | 10 years |
| Customer relationships | 2,500 | | | 3 years |
| Total intangible assets | $ | 14,300 | | | |
The results of operations of mnml are included in the Company’s consolidated results beginning October 14, 2021. Total net sales of $11.6 million and net income attributable to the Company of $1.0 million of mnml are included in the accompanying consolidated statement of income for the year ended December 31, 2021. Goodwill of $29.7 million, none of which is deductible for tax purposes, represents the excess purchase price over the estimated fair values assigned to tangible and identifiable intangible assets acquired and liabilities assumed. The goodwill arising from the acquisition consists largely of anticipated synergies related to combining with the Company’s existing operations.
Total acquisition costs incurred by the Company in connection with the purchase primarily related to third-party legal, accounting and tax diligence fees, were $1.3 million. These costs are recorded in general and administrative expenses in the consolidated statement of income during the year ended December 31, 2021.
Purchase of Noncontrolling Interests
Immediately following the New Excelerate Reorganization (as described in Note 1), the Company completed a series of transactions in which the minority investors exchanged their interests in CK Holdings for 21,809,804 newly issued shares of a.k.a. Brands Holding Corp. common stock. The number of shares issued in exchange for the minority interests was determined based on the relative valuations of CK Holdings and the consolidated a.k.a. group at the time of the IPO. This exchange resulted in the elimination of the noncontrolling interest in Culture Kings, with a value of $132.3 million, and an increase in additional paid-in capital with a nominal amount recorded as common stock at a value of $0.001 per issued share in the exchange. Following the completion of this transaction, CK Holdings became a wholly-owned subsidiary of a.k.a. Brands Holding Corp.
The Company had historically owned 66.7% of the equity interests in P&P Holdings, which operated the Company’s Petal & Pup business prior to the IPO. The remaining 33.3% of the equity interests in P&P Holdings were held by certain minority investors. On August 19, 2021, the Company repurchased approximately 6.0% of the equity held by the P&P minority investors for AUD $5.0 million. In connection with the completion of the IPO, the Company used a portion of the net proceeds from the IPO to fund the acquisition of the remaining 27.3% of the equity interests in P&P Holdings then owned by the P&P minority investors for cash of approximately AUD $22.8 million. As a result of the transaction, noncontrolling interest of $9.6 million was eliminated and the $10.6 million paid in excess of the noncontrolling interest was recorded as a reduction to additional paid-in capital. Following the completion of this purchase, P&P Holdings became a wholly-owned subsidiary of a.k.a. Brands Holding Corp.
Note 4. Prepaid Expenses and Other Current Assets
Prepaid expenses and other current assets are comprised of the following:
| | | | | | | | | | | |
| December 31, |
| 2021 | | 2020 |
| | | |
| Inventory prepayments | 14,251 | | | 3,722 | |
| Other | 6,558 | | | 358 | |
| Total prepaid expenses and other current assets | $ | 20,809 | | | $ | 4,080 | |
Note 5. Property and Equipment, Net
Property and equipment, net is comprised of the following:
| | | | | | | | | | | |
| December 31, |
| 2021 | | 2020 |
Furniture and fixtures | $ | 1,305 | | | $ | 411 | |
Machinery and equipment | 1,595 | | | 185 | |
Computer equipment and capitalized software | 2,638 | | | 753 | |
Leasehold improvements | 12,457 | | | 2,020 | |
Total property and equipment | 17,995 | | | 3,369 | |
Less accumulated depreciation | (3,338) | | | (1,248) | |
Total property and equipment, net | $ | 14,657 | | | $ | 2,121 | |
Total depreciation expense for the years ended December 31, 2021, 2020 and 2019 was $2.7 million, $0.4 million and $0.5 million, respectively.
Note 6. Goodwill
The carrying value of goodwill as of December 31, 2021 and 2020, was $363.3 million and $88.3 million, respectively. No goodwill impairment was recorded for the years ended December 31, 2021 and 2020.
The goodwill of the acquired companies is primarily related to expected improvements in technology performance and functionality, as well as sales growth from future product and service offerings and new customers, together with certain intangible assets that do not qualify for separate recognition. The goodwill of acquired companies is generally not deductible for tax purposes.
The following table summarizes goodwill activity:
| | | | | |
Balance as of December 31, 2019 | $ | 80,221 | |
| |
Changes in foreign currency translation | 8,032 | |
Balance as of December 31, 2020 | 88,253 | |
Acquisitions (Note 3) | 294,200 | |
Changes in foreign currency translation | (19,148) | |
Balance as of December 31, 2021 | $ | 363,305 | |
Note 7. Intangible Assets
The gross amounts and accumulated amortization of acquired identifiable intangible assets with finite useful lives as of December 31, 2021 and 2020, included in intangible assets, net in the accompanying consolidated balance sheets, are as follows:
| | | | | | | | | | | | | | | | | | | | | | | | | | | | | |
| December 31, |
| Useful life | | Weighted Average Amortization Period 2021 | | 2021 | | Weighted Average Amortization Period 2020 | | 2020 |
Customer relationships | 4 years | | 2.5 years | | $ | 24,516 | | | 1.8 years | | $ | 17,100 | |
Brands | 10 years | | 8.9 years | | 100,315 | | | 7.8 years | | 26,680 | |
Website design and software system | 3 years | | 2.2 years | | 1,883 | | | 2.4 years | | 903 | |
Trademarks | 5 years | | 3.3 years | | 114 | | | 4.5 years | | 103 | |
Total intangible assets | | | | | 126,828 | | | | | 44,786 | |
Less accumulated amortization | | | | | (28,541) | | | | | (15,684) | |
Total intangible assets, net | | | | | $ | 98,287 | | | | | $ | 29,102 | |
Amortization of acquired intangible assets with finite useful lives is included in general and administrative expenses and was $13.9 million, $6.4 million and $5.8 million for the years ended December 31, 2021, 2020 and 2019, respectively.
Future estimated amortization expense for acquired identifiable intangible assets is as follows:
| | | | | |
Year ending December 31: | |
| 2022 | $ | 15,349 | |
| 2023 | 13,028 | |
| 2024 | 12,327 | |
| 2025 | 11,022 | |
| 2026 | 10,027 | |
| Thereafter | 36,534 | |
| Total amortization expense | $ | 98,287 | |
Note 8. Debt
Princess Polly Operating Line of Credit
The Company’s subsidiary Princess Polly had an operating line of credit (the “Polly Facility”) up to a maximum of $15.4 million, which was guaranteed by Polly Bidco Pty Ltd. and Polly Holdco Pty Ltd, each subsidiaries of the Company. (“Princess Polly Group”). The assets of the Princess Polly Group were pledged as security under the Polly Facility.
The Polly Facility was available to make cash draws, procure letters of credit instruments and for the provision of ancillary facilities. The Polly Facility matured in November 2021, and was therefore classified as a current liability as of December 31, 2020. As of December 31, 2020, the Company had drawn $6.2 million on the Polly Facility and had $0.8 million drawn in letters of credit which were held as collateral under various custom bonds agreements.
The Company repaid the outstanding balances under the Polly Facility in full and terminated it in February 2021.
Rebdolls Revolving Line of Credit
Rebdolls had a revolving line of credit for a maximum of $0.5 million with Bank of America, N.A. The assets of Rebdolls were pledged as security under this line of credit. As of December 31, 2020, Rebdolls had an outstanding balance of $0.2 million on the revolving line of credit.
The Company repaid the outstanding balances under the revolving line of credit in full on February 28, 2021, the date of its maturity, and terminated it.
Debt Financing for the Culture Kings Acquisition
To fund the acquisition of Culture Kings (refer to Note 3 for additional information), on March 31, 2021, Polly Holdco Pty Ltd. (“Polly”), a wholly owned subsidiary of the Company, entered into a debt agreement with a syndicated group, with an affiliate of Fortress Credit Corp as administrative agent, consisting of a $125.0 million term-loan facility and $25.0 million revolving credit facility.
Polly also issued $25.0 million in senior subordinated notes to certain debt funds of Summit Partners, a related party of the Company (refer to Note 16 for additional information). The combined term loan and senior subordinated notes provided the Company with $144.1 million, net of loan fees of approximately $5.9 million.
Key terms and conditions of each facility were as follows:
•The $125.0 million term loan matured on March 31, 2027 and required the Company to make amortized quarterly payments in aggregate annual amounts equal to 0.8% of the original principal amount. Borrowings under the credit agreement accrued interest, at the option of the borrower, at an adjusted LIBOR plus 7.5% or Alternative Base Rate (“ABR”) plus 6.5%, subject to adjustment based on achieving certain total net secured leverage ratios and subject to a minimum LIBOR threshold of 1.0% per annum.
•The $25.0 million revolving credit facility, which matured on March 31, 2027, accrued interest, at the option of the borrower, at an adjusted LIBOR plus 7.5% or ABR plus 6.5%, subject to adjustment based on achieving certain total net secured leverage ratios. Total loan debt issuance costs of $1.0 million related to the revolving credit facility were incurred. These costs were included in prepaid and other assets and were being amortized over the term of the facility. $13.0 million had been drawn on the revolving credit facility, as a result of the Culture Kings acquisition transaction.
•The senior subordinated notes accrued interest at an annual interest rate of 16.0% and were repayable at the Company’s discretion until maturity on September 30, 2027.
The Company incurred debt issuance costs of $6.9 million, of which $1.0 million related to the revolving credit facility, which were capitalized and included in prepaid and other current assets as deferred financing costs and were being amortized over the life of the facility, or 6 years. The remaining $5.9 million of debt issuance costs relating to the term loan and senior subordinated notes were presented net of the outstanding debt and were being amortized over the life of the outstanding debt, using the effective interest rate method. The Company repaid the term loan, revolving credit facility and senior subordinated notes in full and terminated them in September 2021 in connection with the IPO, as described further below.
New Senior Secured Credit Facility
On September 24, 2021, at the close of the Company’s IPO, certain subsidiaries of the Company entered into a new senior secured credit facility inclusive of a $100.0 million term loan and a $50.0 million revolving line of credit, as well as an option for additional term loan of up to $50.0 million through an accordion feature. Key terms and conditions of each facility were as follows:
•The $100.0 million term loan matures five years after closing and requires the Company to make amortized annual payments of 5.0% during the first and second years, 7.5% during the third and fourth years and 10.0% during the fifth year with the balance of the loan due at maturity. Borrowings under the term loan accrue interest at LIBOR plus an applicable margin dependent upon our net leverage ratio. The highest interest rate under the agreement occurs at a net leverage ratio of greater than 2.75x, yielding an interest rate of LIBOR plus 3.25%.
•The $50.0 million revolving line of credit, which matures five years after closing, accrues interest at LIBOR plus an applicable margin dependent upon our net leverage ratio. The highest interest rate under the agreement occurs at a net leverage ratio of greater than 2.75x, yielding an interest rate of LIBOR plus 3.25%. Additionally, a margin fee of 25-35 basis points is assessed on unused amounts under the revolving line of credit, subject to adjustment based on our net leverage ratio.
•The $50.0 million accordion feature allows the Company to enter into additional term loan borrowings at terms to be agreed upon at the time of issuance, but on substantially the same basis as the original term loan, which includes the requirement to make amortized annual payments at the same cadence as that of the original term loan.
The new senior secured credit facility requires that the Company maintain a maximum total net leverage ratio of 3.50 to 1.00 as of the last day of any fiscal quarter, beginning with the fiscal quarter ended December 31, 2021 through maturity. The new senior secured credit facility also requires that the Company maintain a minimum fixed charge coverage ratio of 1.25 to 1.00 as of the last day of any fiscal quarter, beginning with the fiscal quarter ended December 31, 2021 through maturity. In the event that the Company fails to comply with the financial covenant, the Company will have the option to make certain equity contributions, directly or indirectly, to cure any non-compliance with such covenant, subject to certain other conditions and limitations. Beginning with the fiscal year ended December 31, 2022, and continuing annually thereafter, the Company is required to make a mandatory prepayment as a percentage of excess cash flows, as defined by the credit agreement, in the period based on the Company triggering certain net debt leverage ratios. Specifically, a mandatory prepayment of 50% of excess cash flows is required if the Company’s net leverage ratio exceeds 2.75x, and a mandatory prepayment of 25% of excess cash flows is required if the Company’s net leverage ratio is greater than or equal to 2.25x. As of December 31, 2021, the Company is in compliance with all debt covenants.
The Company incurred $2.7 million of debt issuance costs in relation to the new senior secured credit facility. Of this, $0.9 million relates to the revolver and is capitalized and included in prepaid and other current assets as deferred financing costs to be amortized over the life of the facility, or five years. The remaining $1.8 million of debt issuance costs relates to the term loan and is presented net of our outstanding debt in long term debt on our balance sheet. Debt issuance costs are amortized over the life of the outstanding debt, using the effective interest rate method.
In September 2021, the Company used borrowings from the term loan under this new senior secured credit facility, together with a portion of the proceeds from the IPO, to repay in full and terminate the previous term loan, revolving credit facility and senior subordinated notes entered into in March 2021 in relation to the Culture Kings acquisition. As part of the repayment, the Company also paid $4.5 million in prepayment penalties and wrote-off $6.4 million of unamortized debt issuance costs, all of which is included in the loss on extinguishment of debt in the condensed consolidated statements of income.
In October 2021, the Company borrowed $15.0 million under the revolving line of credit at an applicable interest rate of 3.37% and final payoff due on September 24, 2026. The borrowings on the revolving line of credit were used in the acquisition of mnml. See Note 3 for additional details. In November 2021, subsequent to the draw on the revolver, the Company borrowed $12.0 million of additional term loan under the accordion feature at substantially the same terms as the original term loan. In December 2021, the borrowings from the accordion feature, along with cash on hand, were used to completely repay the borrowings from the revolving line of credit. In connection with the borrowings under the accordion feature, additional debt issuance costs of $0.3 million were incurred and presented net of our outstanding debt in long term debt on our balance sheet, to be amortized over the life of the accordion, using the effective interest rate method.
Total Debt and Interest
Outstanding debt consisted of the following:
| | | | | | | | | | | |
| December 31, |
| 2021 | | 2020 |
Bank loans - flexible rate loan | $ | — | | | $ | 6,385 | |
Term loan | 110,750 | | | — | |
Revolving credit facility | — | | | — | |
Capitalized debt issuance costs | (1,968) | | | (32) | |
| Total debt | 108,782 | | | 6,353 | |
| Less current portion | (5,600) | | | (6,353) | |
Total long-term debt | $ | 103,182 | | | $ | — | |
Interest expense, which included the amortization of debt issuance costs, totaled $9.5 million, $0.3 million and $0.3 million for the years ended December 31, 2021, 2020 and 2019, respectively.
Note 9. Leases
The Company leases office and warehouse facilities under various non-cancellable operating lease agreements (real estate leases). Real estate leases have remaining lease terms of approximately 1 to 10 years, which represent the non-cancellable periods of the leases and include extension options that the Company determined are reasonably certain to be exercised. The Company excludes extension options that are not reasonably certain to be exercised from the lease terms, ranging from approximately 6 months to 3 years. Lease payments consist primarily of fixed rental payments for the right to use the underlying leased assets over the lease terms as well as payments for common area maintenance and administrative services. The Company often receives customary incentives from landlords, such as reimbursements for tenant improvements and rent abatement periods, which effectively reduce the total lease payments owed for these leases. Leases are classified as operating or financing at commencement. The Company does not have any material financing leases.
Operating lease right-of-use assets and liabilities on the consolidated balance sheets represent the present value of the remaining lease payments over the remaining lease terms. The Company uses its incremental borrowing rate to calculate the present value of the lease payments, as the implicit rates in the leases are not readily determinable. Operating lease costs consist primarily of the fixed lease payments included in the operating lease liabilities and are recorded on a straight-line basis over the lease terms.
The Company’s operating lease costs were as follows:
| | | | | | | | | | | | | | | | | |
| Year Ended December 31, |
| 2021 | | 2020 | | 2019 |
| Operating lease costs | $ | 5,823 | | $ | 1,192 | | $ | 479 |
| Variable lease costs | 155 | | 130 | | 118 |
| Total lease costs | $ | 5,978 | | $ | 1,322 | | $ | 597 |
The Company does not have any material short-term leases. The Company does not have any sublease income and the Company’s lease agreements do not contain any residual value guarantees or material restrictive covenants.
Supplemental cash flow information relating to the Company’s operating leases was as follows:
| | | | | | | | | | | | | | | | | |
| Year Ended December 31, |
| 2021 | | 2020 | | 2019 |
| Cash paid for operating lease liabilities | $ | 5,490 | | $ | 1,193 | | $ | 479 |
| Operating lease right-of-use assets obtained in exchange for new operating lease liabilities | 4,073 | | — | | 2,340 |
Other information relating to the Company’s operating leases was as follows:
| | | | | | | | | | | |
| As of December 31, |
| 2021 | | 2020 |
Weighted-average remaining lease term | 6.1 years | | 3.9 years |
Weighted-average discount rate | 3.9% | | 3.6% |
As of December 31, 2021, the maturities of operating lease liabilities were as follows:
| | | | | |
| 2022 | $ | 6,689 |
| 2023 | 6,724 |
| 2024 | 4,094 |
| 2025 | 3,340 |
| 2026 | 2,480 |
Thereafter | 7,380 |
Total remaining lease payments | 30,707 |
Less: imputed interest | 3,616 |
Total operating lease liabilities | 27,091 |
Less: current portion | (5,721) |
Long-term operating lease liabilities | $ | 21,370 |
Note 10. Income Taxes
Income (loss) from continuing operations before income taxes consisted of the following:
| | | | | | | | | | | | | | | | | |
| Year Ended December 31, |
| 2021 | | 2020 | | 2019 |
United States | $ | (245) | | | $ | 8,360 | | | $ | 589 | |
Foreign | (4,994) | | | 13,295 | | | 1,865 | |
Income (loss) from continuing operations before income taxes | $ | (5,239) | | | $ | 21,655 | | | $ | 2,454 | |
The components of the provision for income taxes consisted of the following:
| | | | | | | | | | | | | | | | | |
| Year Ended December 31, |
| 2021 | | 2020 | | 2019 |
Current: | | | | | |
Federal | $ | 2,631 | | | $ | 2,108 | | | $ | 257 | |
State | 733 | | | 310 | | | 47 | |
Foreign | 7,828 | | | 7,099 | | | 2,642 | |
Total | 11,192 | | | 9,517 | | | 2,946 | |
| Deferred: | | | | | |
Federal | (579) | | | 117 | | | 105 | |
State | (42) | | | (17) | | | (1) | |
Foreign | (9,719) | | | (2,767) | | | (2,038) | |
| Total | (10,340) | | | (2,667) | | | (1,934) | |
Income tax expense | $ | 852 | | | $ | 6,850 | | | $ | 1,012 | |
The provision for income taxes differs from the tax computed using the statutory U.S. federal income tax rate of 21% as a result of the following items:
| | | | | | | | | | | | | | | | | |
| Year Ended December 31, |
| 2021 | | 2020 | | 2019 |
Tax expense (benefit) at U.S. statutory rate | $ | (1,100) | | | $ | 4,548 | | | $ | 515 | |
State income taxes, net of federal income tax benefit | 546 | | | 246 | | | 36 | |
Permanent differences | 1,121 | | | 467 | | | 2,802 | |
Foreign tax rate differential | (886) | | | 1,536 | | | 210 | |
Transaction costs | (477) | | | — | | | — | |
Equity-based compensation | 1,689 | | | — | | | — | |
Other | (41) | | | 53 | | | (2,551) | |
| Income tax expense | $ | 852 | | | $ | 6,850 | | | $ | 1,012 | |
The foreign tax rate differential relates to differences between the income tax rates in effect in the foreign countries in which the Company operates, in particular Australia where the corporate tax rate is 30%.
The components of net deferred tax assets (liabilities) were as follows:
| | | | | | | | | | | |
| Year Ended December 31, |
| 2021 | | 2020 |
| Deferred tax assets: | | | |
| Transaction costs | $ | 2,129 | | | $ | 466 | |
Property and equipment | 439 | | | — | |
| Accruals and reserves | 4,397 | | | 1,962 | |
| Lease liabilities | 7,005 | | | 894 | |
| State taxes | — | | | 64 | |
Inventory | 1,653 | | | — | |
| Foreign exchange gains / losses | 92 | | | 373 | |
| Net operating loss carryforwards | — | | | 135 | |
| Subtotal | 15,715 | | | 3,894 | |
| Less: Valuation allowance | — | | | (144) | |
| Total deferred tax assets | 15,715 | | | 3,750 | |
| Deferred tax liabilities: | | | |
Property and equipment | — | | | (439) | |
| Intangible assets | (11,557) | | | (8,378) | |
Right-of-use assets | (7,041) | | | (745) | |
| Inventory | — | | | (70) | |
| Other | (37) | | | (22) | |
| Total deferred tax liabilities | (18,635) | | | (9,654) | |
| Net deferred liabilities | $ | (2,920) | | | $ | (5,904) | |
As of December 31, 2021, the Company did not have any federal or state net operating loss carryforwards. The Company has recorded no valuation allowance as of December 31, 2021 but had recorded a valuation allowance of $0.1 million as of December 31, 2020, primarily related to U.S. net operating loss carryforwards.
The Company had gross deferred tax assets of $15.7 million and $3.9 million and gross deferred tax liabilities of $18.6 million and $9.7 million at December 31, 2021 and 2020, respectively. Management has determined the gross deferred tax assets are more likely than not realizable.
The Company has not provided deferred taxes on unremitted earnings attributable to foreign subsidiaries that have been considered permanently reinvested. As of December 31, 2021, the unremitted earnings from these operations were approximately $11.4 million.
As of December 31, 2021 and 2020, the Company had no uncertain tax positions.
The Company is subject to taxation in the United States, Cayman Islands and Australia. For U.S. federal income tax purposes, 2018 and later tax years remain open for examination by the tax authorities under the normal three-year statute of limitations. For major U.S. states, 2017 and later tax years remain open for examination by the tax authorities under a four-year statute of limitations. For Australia, 2017 and subsequent tax years remain subject to examination.
Tax Contingencies
The Company is subject to income taxes in the United States and Australia. Significant judgment is required in evaluating the Company’s tax positions and determining the provision for income taxes. During the ordinary course of business, the Company considers tax positions for which the ultimate tax determination is uncertain for the purpose of determining whether a reserve is required, despite the Company’s belief that the tax positions are fully supportable. To date the Company has not established a reserve provision because the Company believes that all tax positions are highly certain.
Note 11. Accrued Liabilities
Accrued liabilities consisted of the following:
| | | | | | | | | | | |
| December 31, |
| 2021 | | 2020 |
Accrued salaries and other benefits | $ | 11,746 | | | $ | 3,295 | |
Accrued freight costs | 9,199 | | | 5,012 | |
Sales tax payable | 20,008 | | | 5,718 | |
Accrued marketing costs | 2,543 | | | 959 | |
Accrued professional services | 1,698 | | | 281 | |
Other accrued liabilities | 8,181 | | | 2,904 | |
Total accrued liabilities | $ | 53,375 | | | $ | 18,169 | |
Note 12. Equity-based Compensation
Incentive Plans
2021 Omnibus Incentive Plan
In September 2021, the Company’s board of directors adopted, and its stockholders approved, the 2021 Omnibus Incentive Plan (the “2021 Plan”) which became effective in connection with the IPO. The 2021 Plan provides for the grant of stock options, stock appreciation rights, restricted stock awards, restricted stock units and other forms of equity and cash compensation. A total of 4,900,269 shares of the Company’s common stock were initially reserved for issuance under the 2021 Plan. The number of shares of common stock reserved and available for issuance under the 2021 Plan will automatically increase each January 1, beginning on January 1, 2022, by 1% of the number of shares of the Company’s common stock outstanding on the immediately preceding December 31, or such lesser number of shares as determined by the compensation committee of the Company’s board of directors.
2021 Employee Stock Purchase Plan
In September 2021, the Company’s board of directors adopted, and its stockholders approved, the 2021 Employee Stock Purchase Plan (the “ESPP”) which became effective in connection with the IPO. The ESPP authorizes the issuance of shares of the Company’s common stock pursuant to purchase rights granted to employees. The ESPP includes two components: a “Section 423 Component” and a “Non-Section 423 Component.” The Section 423 Component is intended to qualify as an “employee stock purchase plan” under Section 423 of the Internal Revenue Code (the “Code”) and will be administered, interpreted and construed in a manner consistent with the requirements of Section 423 of the Code and is limited to employees of the Company located in the United States. The Non-Section 423 Component will be granted pursuant to separate offerings designed to achieve tax, securities laws or other objectives for eligible employees of the Company located outside of the United States.
A total of 1,225,067 shares of the Company’s common stock were initially reserved for issuance under the ESPP. The ESPP provides that the number of shares reserved and available for issuance will automatically increase each January 1, beginning on January 1, 2023, by the lesser of 1% of the number of shares of the Company’s common stock outstanding on the immediately preceding December 31, or such lesser number of shares as determined by the compensation committee of the Company’s board of directors.
The offering periods of the ESPP will be six months long and are anticipated to be offered twice per year. The price at which common stock is purchased under the ESPP is equal to 85% of the fair market value of a share of the Company’s common stock on the first or last day of the offering period, whichever is lower.
2018 Stock and Incentive Compensation Plan
Prior to the IPO, the 2018 Stock and Incentive Compensation Plan, as amended, (the “2018 Plan”) provided for the issuance of time-based incentive units and performance-based incentive units issued by Excelerate, L.P. (the predecessor entity of a.k.a. Brands Holding Corp.). In connection with the reorganization transactions and the IPO, all of the equity interests in Excelerate, L.P., including outstanding incentive units issued as equity-based compensation under the 2018 Plan, were transferred to New Excelerate, L.P. (refer to Note 1 for additional information). The incentive units issued under the 2018 Plan participate in distributions from New Excelerate, L.P., but only after investors receive their return of capital plus a specified threshold amount per unit. The total incentive pool size under the plan was 16,475,735 units. The 2018 Plan was terminated in September 2021 in connection with the IPO, but continues to govern the terms of outstanding incentive units that were granted prior to the IPO. No further incentive units will be granted under the 2018 Plan.
Upon the expiration, forfeiture, cancellation or withholding of units for employee taxes of any incentive units underlying outstanding incentive unit awards granted under the 2018 Plan, an equal number of shares of a.k.a. Brands Holding Corp. common stock will become available for grant under the 2021 Plan that was established in connection with the IPO.
Grant Activity
Stock Options
The 2021 Plan provides for the issuance of incentive and nonqualified stock options. Under the 2021 Plan, the exercise price of an incentive stock option shall not be less than the fair market value of one share of the Company’s common stock on the date of grant. Stock options are exercisable over periods not to exceed ten years from the date of grant, and generally vest over time or based on performance. As of December 31, 2021, all stock option grants have been time-based.
A summary of the Company's time-based stock option activity under the 2021 Plan was as follows:
| | | | | | | | | | | | | | | | | |
| Number of Options | | Weighted Average Exercise Price | | Aggregate Intrinsic Value |
Balance as of December 31, 2020 | — | | | $ | 0.00 | | | — | |
Granted | 273,026 | | | 9.50 | | | |
Vested | — | | | 0.00 | | | |
Forfeited/Repurchased | — | | | 0.00 | | |
|
Balance as of December 31, 2021 | 273,026 | | | $ | 9.50 | | | $ | — | |
Vested as of December 31, 2021 | — | | | $ | 0.00 | | | $ | — | |
As of December 31, 2021, there was $1.3 million of total unrecognized compensation cost related to unvested stock options issued under the 2021 Plan, which is expected to be recognized over a weighted average period of 3.7 years.
The assumptions that the Company used to determine the grant date fair value of stock options granted under the 2021 Plan during the year ended December 31, 2021 were as follows, presented on a weighted-average basis:
| | | | | | | | | | | |
| | | |
| | | | | | | |
Risk free interest rate | 1.00 | % | | | | | | |
Expected volatility | 51.32 | % | | | | | | |
Expected dividend yield | 0 | % | | | | | | |
Expected term | 6.08 years | | | | | | |
Restricted Stock Units
The 2021 Plan provides for the issuance of restricted stock units (“RSUs”). RSUs generally vest over four years.
A summary of the Company's RSU activity under the 2021 Plan was as follows:
| | | | | | | | | | | |
| Number of Shares | | Weighted Average Grant Date Fair Value |
Balance as of December 31, 2020 | — | | | $ | 0.00 | |
Granted | 942,371 | | | 9.99 | |
Vested | — | | | 0.00 | |
Forfeited/Repurchased | — | | | 0.00 | |
Balance as of December 31, 2021 | 942,371 | | | $ | 9.99 | |
As of December 31, 2021, there was $8.8 million of total unrecognized compensation cost related to unvested RSUs issued under the 2021 Plan, which is expected to be recognized over a weighted average period of 3.9 years.
Incentive Units
The 2018 Plan provided for the issuance of time-based incentive units and performance-based incentive units. Time-based incentive units generally vest over four years. Performance-based incentive units vest upon the satisfaction of both a performance condition and market condition as described further below.
Time-Based Incentive Partnership Units
The following table summarizes time-based incentive unit activity under the 2018 Plan:
| | | | | | | | | | | | | | | | | | | | | | | |
| Number of Units | | Weighted Average Grant Date Fair value | | Weighted Average Participation Threshold | | Aggregate Intrinsic Value |
| | | | | | | |
| | | | | | | |
| | | | | | | |
Balance as of December 31, 2019 | 3,403,967 | | | $ | 0.48 | | | $ | 1.02 | | | $ | 2,218 | |
Granted | 5,507,644 | | | $ | 1.37 | | | $ | 1.27 | | | |
Vested | (1,200,934) | | | $ | 0.47 | | | $ | 1.02 | | | |
Forfeited/Repurchased | (1,463,051) | | | $ | 0.45 | | | $ | 1.02 | | | |
Balance as of December 31, 2020 | 6,247,626 | | | $ | 1.27 | | | $ | 1.24 | | | $ | 23,688 | |
Granted | 2,079,417 | | | 0.90 | | | 6.36 | | | |
Vested | (2,351,230) | | | 1.21 | | | 1.22 | | | |
Forfeited/Repurchased | — | | | — | | | — | | |
|
Balance as of December 31, 2021 | 5,975,813 | | | $ | 1.16 | | | $ | 3.04 | | | $ | 23,286 | |
Vested as of December 31, 2021 | 3,357,449 | | | | | | | |
As of December 31, 2021, there was $6.4 million of total unrecognized compensation cost related to unvested time-based incentive units issued under the 2018 Plan, which is expected to be recognized over a weighted average period of 2.7 years.
The assumptions that the Company used to determine the grant date fair value of time-based incentive units granted under the 2018 Plan were as follows, presented on a weighted-average basis:
| | | | | | | | | | | | | | | | | |
| Year Ended December 31, |
| 2021 | | 2020 | | 2019 |
Risk free interest rate | 0.16 | % | | 0.24 | % | | 2.08 | % |
Expected volatility | 50 | % | | 50 | % | | 50 | % |
Expected dividend yield | 0 | % | | 0 | % | | 0 | % |
Expected term | 2.87 years | | 3.14 years | | 4.21 years |
Performance-Based Incentive Units
Performance-based incentive units vest upon the satisfaction of both a performance condition and market condition. The performance condition is satisfied upon the occurrence of a liquidity event, defined as a change of control transaction or an initial public offering and is not deemed probable until it occurs. The market condition is satisfied upon the initial investor in Excelerate, L.P. receiving an aggregate return equal to three times its aggregate investment. In connection with the IPO, both the performance condition and the market condition were satisfied. As of December 31, 2021, all outstanding performance-based incentive units have been fully expensed.
The following table summarizes performance-based incentive unit activity under the 2018 Plan:
| | | | | | | | | | | | | | | | | | | | | | | |
| Number of Units | | Weighted Average Grant Date Fair value | | Weighted Average Participation Threshold | | Aggregate Intrinsic Value |
| | | | | | | |
| | | | | | | |
Balance as of December 31, 2019 | 2,322,372 | | | $ | 0.33 | | | $ | 1.02 | | | $ | 1,534 | |
Granted | 3,394,379 | | | $ | 1.09 | | | $ | 1.24 | | | |
Forfeited | (1,254,987) | | | $ | 0.30 | | | $ | 1.01 | | | |
Balance as of December 31, 2020 | 4,461,764 | | | $ | 0.91 | | | $ | 1.19 | | | $ | 17,137 | |
Granted | 932,124 | | | $ | 1.01 | | | $ | 6.09 | | | |
Vested | (5,393,888) | | | 0.93 | | | 2.04 | | | |
Forfeited | — | | | — | | | — | | | |
Balance as of December 31, 2021 | — | | | $ | — | | | $ | 0.00 | | | |
Vested as of December 31, 2021 | 5,393,888 | | | | | | | |
The grant date fair value of the performance-based incentive units was determined the using the Black-Scholes option pricing model, modified to allow for vesting only if the value at the distribution date is at or above the performance threshold.
Transition Agreement
During the year ended December 31, 2020, the Company entered into a transition agreement with a former executive whereby all unvested incentive units were forfeited upon her termination. Pursuant to the terms of this transition agreement, the former executive retained 261,287 vested incentive units following her termination. As permitted by the original terms of the incentive units, the Company exercised its right to repurchase the former executive’s remaining 802,634 vested incentive units for total cash consideration of $1.1 million payable within a certain period following her termination. The consideration payable was deducted from additional paid-in capital as it did not exceed the fair value of the repurchased incentive units as of the date of repurchase, and was outstanding as of December 31, 2021.
Equity-Based Compensation Expense
The Company recognizes compensation expense in general and administrative expenses within operating expenses for stock options, RSUs and time-based incentive units granted prior to the IPO by amortizing the grant date fair value on a straight-line basis over the expected vesting period to the extent the vesting of the grant is considered probable. The Company recognized compensation expense for performance-based incentive units granted prior to the IPO at the date of IPO. The Company recognizes equity-based award forfeitures in the period such forfeitures occur.
The following table summarizes the Company’s equity-based compensation expense by award type for all Plans:
| | | | | | | | | | | | | | | | | |
| Year Ended December 31, |
| 2021 | | 2020 | | 2019 |
| Stock options | $ | 95 | | | $ | — | | | $ | — | |
| RSUs | 655 | | | — | | | — | |
| Time-based incentive units | 2,390 | | | 1,380 | | | 353 | |
| Performance-based incentive units | 4,903 | | | — | | | — | |
| Total | $ | 8,043 | | | $ | 1,380 | | | $ | 353 | |
Note 13. Stockholders’ Equity
Preferred Stock
In connection with the IPO, the Company’s amended and restated certificate of incorporation became effective, which authorized the issuance of 50,000,000 shares of undesignated preferred stock with a par value of $0.001 per share with rights and preferences, including voting rights, designated from time to time by the Company’s board of directors.
Common Stock
The Company has one class of common stock. In connection with the IPO, the Company’s amended and restated certificate of incorporation became effective, which authorized the issuance of 500,000,000 shares of common stock with a par value of $0.001 per share, with one vote per share. Holders of common stock are entitled to receive any dividends as may be declared from time to time by the Company’s board of directors.
Note 14. Net Income (Loss) Per Share
The following table sets forth the computation of basic and diluted net income (loss) per share and a reconciliation of the weighted average number of shares outstanding:
| | | | | | | | | | | | | | | | | |
| Year Ended December 31, |
| 2021 | | 2020 | | 2019 |
| Numerator: | | | | | |
| Net income (loss) attributable to a.k.a. Brands Holding Corp. | $ | (5,968) | | | $ | 14,334 | | | $ | 1,394 | |
| Denominator: | | | | | |
Weighted-average common shares outstanding, basic | 93,231,377 | | | 69,846,362 | | | 61,988,641 | |
| Dilutive securities: | | | | | |
| Stock options | — | | | — | | | — | |
| RSUs | — | | | — | | | — | |
Weighted-average common shares outstanding, diluted | 93,231,377 | | | 69,846,362 | | | 61,988,641 | |
| Net income (loss) per share: | | | | | |
Net income (loss) per share, basic | $ | (0.06) | | | $ | 0.21 | | | $ | 0.02 | |
Net income (loss) per share, diluted | $ | (0.06) | | | $ | 0.21 | | | $ | 0.02 | |
Due to the reorganization transactions as described in Note 1, for periods prior to our IPO in September 2021, a split of units held by New Excelerate investors into a proportionate amount of shares of the Company’s common stock is reflected in the weighted-average common shares outstanding. The Company used the two-class method in calculating net income per share historically, as it related to the outstanding incentive units. However, for all periods prior to the IPO, there were no potentially dilutive securities. Accordingly, basic and diluted net income per share presented herein and on the condensed consolidated statements of income for all periods prior to the IPO are the same.
Basic net income (loss) per share is calculated by dividing net income (loss) attributable to a.k.a. Brands Holding Corp. for the period by the weighted-average number of shares of common stock for the period. Diluted net income (loss) per share has been calculated in a manner consistent with that of basic net income (loss) per share while giving effect to shares of potentially dilutive stock option and RSU grants outstanding during the period, if applicable.
Note 15. Commitments and Contingencies
Contingencies
The Company records a loss contingency when it is probable that a liability has been incurred and the amount of the loss can be reasonably estimated. The Company also discloses material contingencies when it believes a loss is not probable but reasonably possible. Accounting for contingencies requires us to use judgment related to both the likelihood of a loss and the estimate of the amount or range of loss. Although the Company cannot predict with assurance the outcome of any litigation or tax matters, it does not believe there are currently any such actions that, if resolved unfavorably, would have a material impact on the Company’s operating results, financial position or cash flows.
Indemnifications
In the ordinary course of business, the Company may provide indemnifications of varying scope and terms to vendors, directors, officers and other parties with respect to certain matters. The Company has not incurred any material costs as a result of such indemnifications and has not accrued any liabilities related to such obligations in the consolidated financial statements.
Note 16. Related Party Transactions
The Company may enter into transactions with related parties from time to time.
Related Party Debt Financing
In connection with the acquisition of Culture Kings (refer to Note 3 for additional information), on March 31, 2021, Polly Holdco Pty Ltd., a wholly owned subsidiary of the Company, issued $25.0 million in senior subordinated notes to an affiliate of Summit, a global investment firm who has a majority ownership interest in the Company. The senior subordinated notes were subsequently paid in full and terminated in connection with the IPO (refer to Note 8 for additional information).
Note 17. Subsequent Events
The Company has evaluated subsequent events occurring through March 1, 2022, the date that these financial statements were originally available to be issued, and determined the following subsequent events occurred that would require disclosure in these financial statements.
Draw on Revolving Line of Credit
On January 26, 2022, the Company borrowed $15.0 million under the revolving line of credit established as part of its senior secured credit facility effective September 24, 2021. The applicable interest rate for the borrowings is 3.52% and final payoff is due on September 24, 2026.
Culture Kings Las Vegas Flagship Store Lease
On January 31, 2022, the Company entered into a lease agreement with Forum Shops, LLC to lease approximately 13,425 square feet of selling space located in the Forum Shops at Caesars Palace. The lease will have a commencement date in the first quarter of 2022 and will be material to the Company’s operations with a first year annual cash payment of approximately $1.7 million and subsequent annual cash payments that increase by 3.0% each year through the tenth anniversary of the lease commencement.
ITEM 9. CHANGES IN AND DISAGREEMENTS WITH ACCOUNTANTS ON ACCOUNTING AND FINANCIAL DISCLOSURES
None.
ITEM 9A. CONTROLS AND PROCEDURES
Evaluation of Disclosure Controls and Procedures
Our management, with the participation of our chief executive officer and chief financial officer, has evaluated the effectiveness of our disclosure controls and procedures (as defined in Rules 13a-15(e) and 15d-15(e) under the Exchange Act), as of the end of the fiscal year covered by this Annual Report on Form 10-K. This evaluation is performed to determine whether our disclosure controls and procedures are effective to provide reasonable assurance that information required to be disclosed by the Company in the reports that it files or submits under the Exchange Act is accumulated and communicated to management, including our chief executive officer and chief financial officer, as appropriate, to allow timely decisions regarding required disclosure and are effective to provide reasonable assurance that such information is recorded, processed, summarized and reported within the time periods specified by the SEC’s rules and forms. Due to the material weaknesses described below, our chief executive officer and chief financial officer concluded that the Company’s disclosure controls and procedures were not effective as of December 31, 2021. In light of this fact, our management has performed additional analyses, reconciliations, and other post-closing procedures and has concluded that, notwithstanding the material weaknesses in our internal control over financial reporting, the consolidated financial statements for the periods covered by and included in this Annual Report on Form 10-K fairly present, in all material respects, our financial position, results of operations and cash flows for the periods presented in conformity with GAAP.
Material Weaknesses
As disclosed in our final prospectus filed with the SEC on September 23, 2021 pursuant to Rule 424(b) under the Securities Act, we identified three material weaknesses in the design and operation of our internal control over financial reporting in connection with the preparation of our financial statements for the fiscal years ended December 31, 2020 and 2019. A material weakness is a deficiency, or a combination of deficiencies, in internal control over financial reporting such that there is a reasonable possibility that a material misstatement of a company’s annual or interim financial statements will not be prevented or detected on a timely basis. The Company’s management, including our chief executive officer and chief financial officer concluded that:
•We have not sufficiently designed, implemented and documented internal controls at the entity level and across the key business and financial processes to allow us to achieve complete, accurate and timely financial reporting.
•We have not designed and implemented controls to maintain appropriate segregation of duties in our manual and IT-based business processes.
•We have insufficient resources with the appropriate knowledge and experience in our accounting function related to GAAP and the SEC reporting requirements of a U.S. domestic registrant to enable us to design and maintain an effective financial reporting process.
Remediation Status of Material Weaknesses
Material weakness related to the design, implementation and documentation of internal controls at the entity level and across key business and financial process.
We have taken numerous steps to address the underlying causes of this material weakness. We have hired additional experienced financial reporting personnel and put new processes in place to achieve complete, accurate and timely financial reporting. We have also hired a third-party consulting firm with expertise to help us design, implement and document our internal controls across the organization.
Material weakness related to appropriate segregation of duties in our manual and IT-based business processes.
We have commenced a process to (i) identify key systems and processes that require improved documentation, (ii) implement enhanced standards designed to meet the requirements of the Sarbanes-Oxley Act for segregation of duties, (iii) review the design of applicable internal controls and assess any required amendments and (iv) increase the training of accounting and finance staff in relevant areas.
While progress has been made to remediate both of the material weaknesses above, as of December 31, 2021, we are still in the process of developing and implementing the enhanced processes and procedures and testing the operating effectiveness of these improved controls. We believe our actions will be effective in remediating the material weaknesses, and we continue to devote significant time and attention to these efforts. In addition, the material weaknesses will not be considered remediated until the applicable remedial processes and procedures have been in place for a sufficient period of time and management has concluded, through testing, that these controls are effective. Accordingly, the material weaknesses above are not remediated as of December 31, 2021.
Material weakness related to insufficient resources with the appropriate knowledge and experience in our accounting function.
To address and remediate this material weakness the Company hired additional accounting and financial reporting personnel with extensive knowledge and experience related to U.S. GAAP and the SEC reporting requirements of U.S. domestic registrants. Accordingly, we believe we have remediated the material weakness that the Company has insufficient resources with the appropriate knowledge and experience to enable us to design and maintain an effective financial reporting process.
Changes in Internal Control over Financial Reporting
Except for the remediation efforts described above, there were no changes in our internal control over financial reporting identified in connection with the evaluation required by Rules 13a-15(d) and 15d-15(d) of the Exchange Act that occurred during the period covered by this Annual Report on Form 10-K that has materially affected, or is reasonably likely to materially affect, our internal control over financial reporting.
Limitations on Effectiveness of Controls and Procedures
In designing and evaluating our disclosure controls and procedures, management recognizes that any controls and procedures, no matter how well designed and operated, can provide only reasonable assurance of achieving their objectives and management necessarily applies its judgment in evaluating the cost-benefit relationship of possible controls and procedures.
Management’s Report on Internal Control over Financial Reporting
This Annual Report on Form 10-K does not include a report of management's assessment regarding internal control over financial reporting or an attestation of our independent registered public accounting firm as permitted in this transition period under the rules of the SEC for newly public companies.
ITEM 9B. OTHER INFORMATION
None.
PART III
ITEM 10. DIRECTORS, EXECUTIVE OFFICERS AND CORPORATE GOVERNANCE
The information required by this item will be set forth in our Proxy Statement for the 2022 Annual Meeting of Stockholders (the “2022 Proxy Statement”) to be filed with the SEC within 120 days of our fiscal year ended December 31, 2021 and is incorporated herein by reference.
ITEM 11. EXECUTIVE COMPENSATION
The information required by this item will be set forth in our 2022 Proxy Statement and is incorporated herein by reference.
ITEM 12. SECURITY OWNERSHIP OF CERTAIN BENEFICIAL OWNERS AND MANAGEMENT AND RELATED STOCKHOLDER MATTERS
The information required by this item will be set forth in our 2022 Proxy Statement and is incorporated herein by reference.
ITEM 13. CERTAIN RELATIONSHIPS AND RELATED TRANSACTIONS, AND DIRECTOR INDEPENDENCE
The information required by this item will be set forth in our 2022 Proxy Statement and is incorporated herein by reference.
ITEM 14. PRINCIPAL ACCOUNTANT FEES AND SERVICES
The information required by this item will be set forth in our 2022 Proxy Statement and is incorporated herein by reference.
PART IV
ITEM 15. EXHIBITS AND FINANCIAL STATEMENT SCHEDULES
(a) The following documents are filed as part of this Annual Report on Form 10-K:
1. Consolidated Financial Statements
2. Financial Statement Schedules
Schedules have been omitted because they are either not required, not applicable, not present in amounts sufficient to require submission of the schedule or the required information is included elsewhere in this Annual Report on Form 10-K.
3. Exhibits
The following exhibits are filed herewith or incorporated by reference herein:
| | | | | | | | | | | | | | | | | | | | | | | | | | | | | | | | |
| | | | Incorporated by Reference |
| Exhibit No. | | Description | | Form | | File No. | | Filing Date | | Exhibit No. |
| 3.1 | | | | 8-K | | 001-40828 | | September 27, 2021 | | 3.1 |
| 3.2 | | | | 8-K | | 001-40828 | | September 27, 2021 | | 3.2 |
| 4.1 | | | | 8-K | | 001-40828 | | September 27, 2021 | | 4.1 |
| 4.2* | | | | | | | | | | |
| 10.1 | | | | S-1 | | 333-259028 | | August 24, 2021 | | 10.2 |
| 10.2 | | | | S-1 | | 333-259028 | | August 24, 2021 | | 10.3 |
| 10.3 | | | | 8-K | | 001-40828 | | September 27, 2021 | | 10.1 |
| 10.4 | | | | 8-K | | 001-40828 | | September 27, 2021 | | 10.2 |
10.5† | | | | S-8 | | 333-259753 | | September 24, 2021 | | 10.1 |
10.6† | | | | S-8 | | 333-259753 | | September 24, 2021 | | 10.2 |
10.7† | | | | S-8 | | 333-259753 | | September 24, 2021 | | 10.3 |
10.8† | | | | S-8 | | 333-259753 | | September 24, 2021 | | 10.4 |
10.9† | | | | S-8 | | 333-259753 | | September 24, 2021 | | 10.5 |
10.10† | | | | S-1 | | 333-259028 | | August 24, 2021 | | 10.10 |
10.11† | | | | S-1 | | 333-259028 | | August 24, 2021 | | 10.11 |
10.12† | | | | S-1 | | 333-259028 | | August 24, 2021 | | 10.12 |
10.13† | | | | S-1 | | 333-259028 | | August 24, 2021 | | 10.13 |
| | | | | | | | | | | | | | | | | | | | | | | | | | | | | | | | |
10.14† | | | | S-1 | | 333-259028 | | August 24, 2021 | | 10.14 |
10.15† | | | | S-1 | | 333-259028 | | August 24, 2021 | | 10.15 |
10.16† | | | | S-1 | | 333-259028 | | August 24, 2021 | | 10.16 |
10.17† | | | | S-1 | | 333-259028 | | August 24, 2021 | | 10.17 |
10.18† | | | | S-1 | | 333-259028 | | August 24, 2021 | | 10.18 |
| 21.1* | | | | | | | | | | |
| 23.1* | | | | | | | | | | |
| 31.1* | | | | | | | | | | |
| 31.2* | | | | | | | | | | |
| 32.1** | | | | | | | | | | |
| 32.2** | | | | | | | | | | |
| 101.INS* | | Inline XBRL Instance Document. | | | | | | | | |
| 101.SCH* | | Inline XBRL Taxonomy Extension Schema Document. | | | | | | | | |
| 101.CAL* | | Inline XBRL Taxonomy Extension Calculation Linkbase Document. | | | | | | | | |
| 101.DEF* | | Inline XBRL Taxonomy Extension Definition Linkbase Document. | | | | | | | | |
| 101.LAB* | | Inline XBRL Taxonomy Extension Labels Linkbase Document. | | | | | | | | |
| 101.PRE* | | Inline XBRL Taxonomy Extension Calculation Linkbase Document. | | | | | | | | |
| 104* | | Cover Page Interactive Data File (formatted as inline XBRL and contained in Exhibit 101). | | | | | | | | |
__________† Management contract or compensatory plan or arrangement.
* Filed herewith.
** Furnished herewith. The certifications attached as Exhibits 32.1 and 32.2 that accompany this Annual Report on Form 10-K are deemed furnished and not filed with the SEC and are not to be incorporated by reference into any filing of the Company under the Securities Act or the Exchange Act, whether made before or after the date of this Annual Report on Form 10-K, irrespective of any general incorporation language contained in such filing.
ITEM 16. FORM 10-K SUMMARY
Not Applicable.
SIGNATURES
Pursuant to the requirements of the Securities Exchange Act of 1934, the registrant has duly caused this Annual Report on Form 10-K to be signed on its behalf by the undersigned, thereunto duly authorized, in the City of San Francisco, State of California, on March 1, 2022.
| | | | | | | | |
| a.k.a. Brands Holding Corp. |
| | |
| By: | /s/ Jill Ramsey |
| Name: | Jill Ramsey |
| Title: | Chief Executive Officer |
POWER OF ATTORNEY
KNOW ALL PERSONS BY THESE PRESENTS, that each person whose signature appears below constitutes and appoints Jill Ramsey or Ciaran Long, or any of them, his or her attorneys-in-fact, for such person in any and all capacities, to sign any amendments to this report and to file the same, with exhibits thereto, and other documents in connection therewith, with the Securities and Exchange Commission, hereby ratifying and confirming all that either of said attorneys-in-fact, or substitute or substitutes, may do or cause to be done by virtue hereof.
Pursuant to the requirements of the Securities Exchange Act of 1934, this report has been signed below by the following persons on behalf of the Registrant and in the capacities and on the dates indicated.
| | | | | | | | | | | | | | |
| Signature | | Title | | Date |
| | | | |
| /s/ Jill Ramsey | | Chief Executive Officer and Director | | March 1, 2022 |
| Jill Ramsey | | (Principal Executive Officer) | | |
| | | | |
| /s/ Ciaran Long | | Chief Financial Officer | | March 1, 2022 |
| Ciaran Long | | (Principal Financial Officer and
Principal Accounting Officer) | | |
| | | | |
| /s/ Myles McCormick | | Director | | March 1, 2022 |
| Myles McCormick | | | | |
| | | | |
| /s/ Kelly Thompson | | Director | | March 1, 2022 |
| Kelly Thompson | | | | |
| | | | |
| /s/ Christopher Dean | | Chairman of the Board of Directors | | March 1, 2022 |
| Christopher Dean | | | | |
| | | | |
| /s/ Matthew Hamilton | | Director | | March 1, 2022 |
| Matthew Hamilton | | | | |
| | | | |
| /s/ Wesley Bryett | | Director | | March 1, 2022 |
| Wesley Bryett | | | | |
| | | | |
| /s/ Simon Beard | | Director | | March 1, 2022 |
| Simon Beard | | | | |
| | | | |
| /s/ Ilene Eskenazi | | Director | | March 1, 2022 |
| Ilene Eskenazi | | | | |